Will Bulls Reclaim Control or Lose Ground? 🔥
🟩 Daily Timeframe – Macro Market Structure
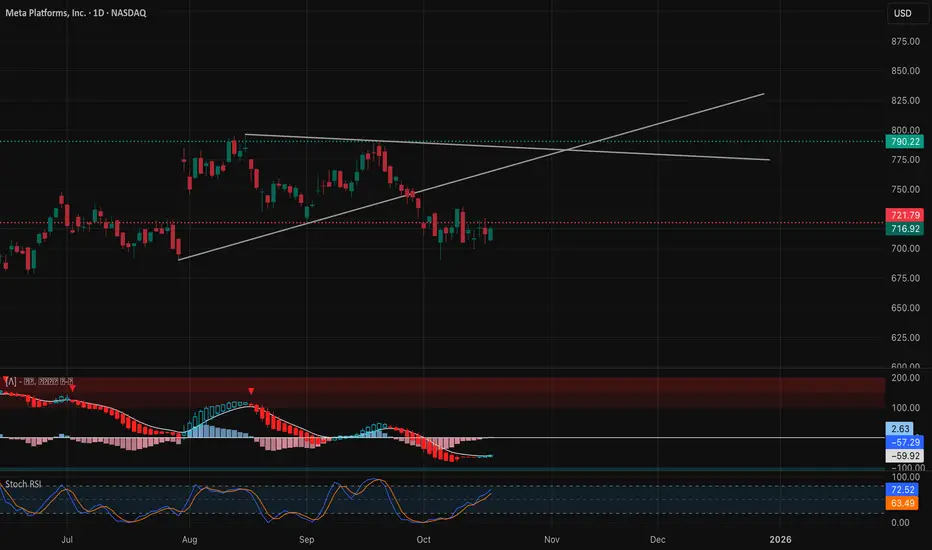
META remains in a mid-term corrective phase inside a broader bullish structure that began in early summer. After topping around $820, price broke its ascending trendline and has since been consolidating between $716 support and $790 resistance.
The daily structure shows a descending wedge pattern forming within that range — a potential base-building setup if buyers can reclaim momentum. The MACD histogram is negative but contracting, showing the bearish momentum is starting to fade. Stoch RSI has lifted off the oversold region, hinting at the start of a possible momentum reset.
Smart money likely absorbed liquidity around $710–$720, and if bulls can defend that pocket, we could see a mean-reversion move toward $760–$775. A break below $705 would invalidate this recovery scenario and confirm continued distribution toward $685.
🟦 1-Hour Timeframe – Short-Term Structure and Momentum

On the 1-hour chart, META shows a tactical CHoCH → BOS sequence, confirming the first bullish shift since last week’s low near $698–$700. Price reclaimed the short-term structure with a BOS at $712, and is now consolidating just under $717–$725, the next liquidity pocket where sellers previously stepped in.
Key intraday dynamics:
* 9 EMA is curling upward above the 21 EMA, confirming a mild bullish bias.
* MACD histogram flipped positive with rising momentum, but still early in development.
* RSI trending toward 60, suggesting momentum buildup but not yet overextended.
For this week, $712 serves as a pivot: holding above it keeps structure bullish; slipping below reopens downside back to $705. Upside continuation requires a strong hourly close above $725, unlocking room toward $735–$740.
🟨 15-Minute Timeframe – Intraday Structure and Scalping Levels

META’s 15-minute chart paints a clear picture of short-term liquidity rotation. Several CHoCH and BOS events occurred between $706–$717, forming a rising intraday channel. The most recent BOS at $716 established a new higher-high sequence, but a small CHoCH appeared right after, hinting at local exhaustion.
* Momentum via MACD is flattening after a solid run — possible micro pullback ahead.
* Stoch RSI dipping from the upper band, showing cooling intraday momentum.
* Key zones: $712.5–$714 short-term support, $717.5–$725 resistance box.
If bulls can defend $714 and reclaim $717.5 with volume, expect a quick extension to $725+. A failure here could reset the range and sweep liquidity back toward $707 before any renewed rally attempt.
🟥 GEX (Gamma Exposure) & Options Sentiment – Dealer Positioning Map

Gamma data aligns perfectly with META’s price compression setup:
* Highest positive gamma / call resistance: $735–$740 → strong dealer sell pressure overhead.
* Highest negative gamma / put support: $705 → dealers likely to buy into dips.
* Call walls: $720–$735, layering multiple gamma bands that could slow breakout attempts.
* Put walls: $690–$680, matching the broader liquidity shelf from October lows.
* Max Pain: roughly $715, suggesting potential mid-week magnet as volatility compresses.
With IVR 43.1 and IVx slightly below average (−3.3%), implied volatility remains subdued, meaning a coiling market is forming before the next catalyst. Dealers are slightly long gamma, so early-week dips may get absorbed while rallies above $725 could face mechanical selling.
Strategic plays:
* Scalpers: Favor long setups on $714 rebounds → target $725.
* Directional traders: Look for breakout confirmation above $725 → target $735–$740.
* Options traders: Iron condors or debit spreads between $710–$730 fit the current GEX profile.
🎯 Trade Scenarios
Bullish Setup 🟢
* Entry: Above $717.5–$718.5 on confirmation candle.
* Targets: $725 → $735.
* Stop-loss: Below $711.
* Bias confirmation: MACD expansion + RSI > 60 on 15M & 1H.
Bearish Setup 🔴
* Entry: On rejection from $725–$730 or breakdown below $711–$712.
* Targets: $705 → $690.
* Stop-loss: Above $727.
* Confluence: MACD turning negative + RSI < 45 with 9 EMA crossing below 21 EMA.
🧭 Closing Outlook – Week of Oct 21–25
META enters the week in sideways accumulation, hovering just above key liquidity at $712. With gamma support below and call walls overhead, the market is in a coiled spring state.
If bulls defend $711–$714, we may see a measured breakout attempt toward $735–$740 later in the week. Failure to reclaim $717 with volume, however, would likely drag the stock back to retest $705–$698 before finding real demand again.
Personally, I’m watching for fake sweeps around $712–$714 — if liquidity traps trigger here, that could be the ignition point for a short-covering rally.
Disclaimer: This analysis is for educational purposes only and does not constitute financial advice. Always perform your own due diligence and trade responsibly.
🟩 Daily Timeframe – Macro Market Structure
META remains in a mid-term corrective phase inside a broader bullish structure that began in early summer. After topping around $820, price broke its ascending trendline and has since been consolidating between $716 support and $790 resistance.
The daily structure shows a descending wedge pattern forming within that range — a potential base-building setup if buyers can reclaim momentum. The MACD histogram is negative but contracting, showing the bearish momentum is starting to fade. Stoch RSI has lifted off the oversold region, hinting at the start of a possible momentum reset.
Smart money likely absorbed liquidity around $710–$720, and if bulls can defend that pocket, we could see a mean-reversion move toward $760–$775. A break below $705 would invalidate this recovery scenario and confirm continued distribution toward $685.
🟦 1-Hour Timeframe – Short-Term Structure and Momentum
On the 1-hour chart, META shows a tactical CHoCH → BOS sequence, confirming the first bullish shift since last week’s low near $698–$700. Price reclaimed the short-term structure with a BOS at $712, and is now consolidating just under $717–$725, the next liquidity pocket where sellers previously stepped in.
Key intraday dynamics:
* 9 EMA is curling upward above the 21 EMA, confirming a mild bullish bias.
* MACD histogram flipped positive with rising momentum, but still early in development.
* RSI trending toward 60, suggesting momentum buildup but not yet overextended.
For this week, $712 serves as a pivot: holding above it keeps structure bullish; slipping below reopens downside back to $705. Upside continuation requires a strong hourly close above $725, unlocking room toward $735–$740.
🟨 15-Minute Timeframe – Intraday Structure and Scalping Levels
META’s 15-minute chart paints a clear picture of short-term liquidity rotation. Several CHoCH and BOS events occurred between $706–$717, forming a rising intraday channel. The most recent BOS at $716 established a new higher-high sequence, but a small CHoCH appeared right after, hinting at local exhaustion.
* Momentum via MACD is flattening after a solid run — possible micro pullback ahead.
* Stoch RSI dipping from the upper band, showing cooling intraday momentum.
* Key zones: $712.5–$714 short-term support, $717.5–$725 resistance box.
If bulls can defend $714 and reclaim $717.5 with volume, expect a quick extension to $725+. A failure here could reset the range and sweep liquidity back toward $707 before any renewed rally attempt.
🟥 GEX (Gamma Exposure) & Options Sentiment – Dealer Positioning Map
Gamma data aligns perfectly with META’s price compression setup:
* Highest positive gamma / call resistance: $735–$740 → strong dealer sell pressure overhead.
* Highest negative gamma / put support: $705 → dealers likely to buy into dips.
* Call walls: $720–$735, layering multiple gamma bands that could slow breakout attempts.
* Put walls: $690–$680, matching the broader liquidity shelf from October lows.
* Max Pain: roughly $715, suggesting potential mid-week magnet as volatility compresses.
With IVR 43.1 and IVx slightly below average (−3.3%), implied volatility remains subdued, meaning a coiling market is forming before the next catalyst. Dealers are slightly long gamma, so early-week dips may get absorbed while rallies above $725 could face mechanical selling.
Strategic plays:
* Scalpers: Favor long setups on $714 rebounds → target $725.
* Directional traders: Look for breakout confirmation above $725 → target $735–$740.
* Options traders: Iron condors or debit spreads between $710–$730 fit the current GEX profile.
🎯 Trade Scenarios
Bullish Setup 🟢
* Entry: Above $717.5–$718.5 on confirmation candle.
* Targets: $725 → $735.
* Stop-loss: Below $711.
* Bias confirmation: MACD expansion + RSI > 60 on 15M & 1H.
Bearish Setup 🔴
* Entry: On rejection from $725–$730 or breakdown below $711–$712.
* Targets: $705 → $690.
* Stop-loss: Above $727.
* Confluence: MACD turning negative + RSI < 45 with 9 EMA crossing below 21 EMA.
🧭 Closing Outlook – Week of Oct 21–25
META enters the week in sideways accumulation, hovering just above key liquidity at $712. With gamma support below and call walls overhead, the market is in a coiled spring state.
If bulls defend $711–$714, we may see a measured breakout attempt toward $735–$740 later in the week. Failure to reclaim $717 with volume, however, would likely drag the stock back to retest $705–$698 before finding real demand again.
Personally, I’m watching for fake sweeps around $712–$714 — if liquidity traps trigger here, that could be the ignition point for a short-covering rally.
Disclaimer: This analysis is for educational purposes only and does not constitute financial advice. Always perform your own due diligence and trade responsibly.
Declinazione di responsabilità
Le informazioni ed i contenuti pubblicati non costituiscono in alcun modo una sollecitazione ad investire o ad operare nei mercati finanziari. Non sono inoltre fornite o supportate da TradingView. Maggiori dettagli nelle Condizioni d'uso.
Declinazione di responsabilità
Le informazioni ed i contenuti pubblicati non costituiscono in alcun modo una sollecitazione ad investire o ad operare nei mercati finanziari. Non sono inoltre fornite o supportate da TradingView. Maggiori dettagli nelle Condizioni d'uso.