MSFT – Key Compression Zone Before Earnings: Bulls Defending $510 Support ⚡️
🟩 Daily Timeframe – Macro Market Structure
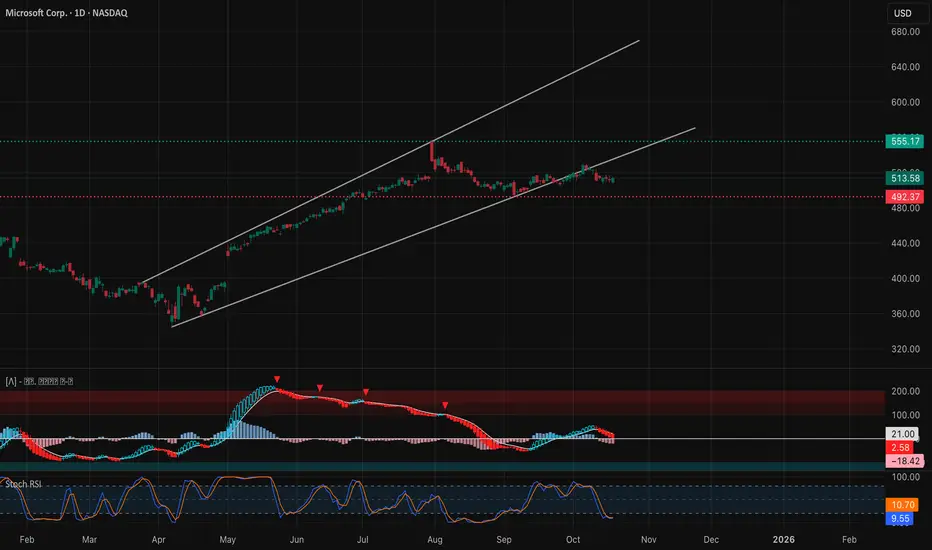
Microsoft’s daily chart remains technically bullish in the larger structure but has clearly lost short-term momentum after peaking in late September. Price is now hovering near the lower boundary of its ascending channel, testing the $510 zone — a crucial level for trend continuation.
The ascending channel from early 2024 remains intact, but a break below $507–$505 could trigger a deeper retracement toward the next structural demand zone around $492–$495. On the other hand, a clean bounce from this area could reestablish upside momentum back to $535–$555, aligning with the upper channel resistance.
MACD remains weak with histogram bars printing below the zero line, showing fading bullish energy. Meanwhile, the Stoch RSI is deeply oversold — signaling that momentum is stretched to the downside and a short-term bounce could soon emerge.
This is a make-or-break zone for bulls: defend $510, and we likely see a mean reversion push higher; lose it, and bears gain control toward $495.
🟦 1-Hour Timeframe – Short-Term Trend and Liquidity Shifts

The 1-hour chart reveals a tactical CHoCH → BOS sequence, suggesting buyers are trying to rebuild structure from the intraday low near $504. Price reclaimed minor structure with a BOS at $511, now holding within the $514–$517 resistance box — an area where liquidity previously flipped.
Key observations:
* CHoCH at $504 followed by BOS above $511, signaling short-term bullish intent.
* 9 EMA crossing above 21 EMA — slope slightly upward, confirming near-term bullish pressure.
* MACD histogram turning positive, showing momentum recovering after a multi-day decline.
* RSI hovering near mid-50s — balanced, with room to expand higher.
For Monday–Tuesday, $511.5–$512 remains the key pivot. If price sustains above it with volume, next upside magnet sits at $517–$520. Failure there likely invites another retest toward $507 support.
🟨 15-Minute Timeframe – Intraday Playbook and Micro Structure

The 15-minute chart captures microstructure perfectly. Multiple CHoCH → BOS patterns have appeared within a rising intraday wedge from $506 → $516. This shows strong liquidity cycling between these levels — smart money likely rotating positions around the $514–$515 supply block.
Current setup:
* The latest BOS pushed price into $516.5, but a CHoCH printed immediately after, hinting at short-term exhaustion.
* Price is now compressing between $511.5 (support) and $516 (resistance) — forming a tight scalp zone.
* MACD on the 15-min is fading, showing weaker follow-through after the morning push.
* Stoch RSI curling down from overbought, suggesting intraday pullback risk before any further upside attempt.
If price breaks above $516.8, momentum could accelerate toward $520–$522. Otherwise, expect a short-term dip to $511 before bulls reattempt another leg higher.
🟥 GEX (Gamma Exposure) & Options Sentiment – Dealer Positioning Map

The GEX map gives a clear picture of the current battleground:
* Highest positive gamma / call resistance: $520–$528, where dealers will likely sell into rallies.
* Highest negative gamma / put support: $510, aligning perfectly with the structural support on your daily and 1H charts.
* Large call walls: $525–$535, indicating upside friction where hedging could mute rallies.
* Put walls: $495–$490, aligning with the downside liquidity zone.
* Max Pain: near $510, meaning price may stay magnetized to this level early in the week.
Implied volatility is stable — IVR 34.2 and IVx average 29.9, signaling that options markets are not pricing extreme movement yet. This supports a range-trading bias early week, likely between $510–$520 before volatility expands later.
Dealers currently hold slightly positive gamma, meaning dips will attract buy hedging and limit deep selloffs. If price breaks above $520, gamma flips bearish — expect volatility expansion as dealers hedge short deltas.
🎯 Trade Scenarios
Bullish Setup 🟢
* Entry: Above $516.5–$517 after confirmation candle.
* Target: $520 → $525.
* Stop-loss: Below $511 (or trailing under EMA crossover).
* Confluence: MACD expansion and RSI > 60 on 15M and 1H.
Bearish Setup 🔴
* Entry: On rejection from $517–$520 or breakdown below $511.
* Target: $507 → $495.
* Stop-loss: Above $521.5.
* Confluence: MACD histogram turning negative + RSI < 45.
🧭 Closing Outlook – Week of Oct 21–25
Microsoft is entering a tight volatility pocket where dealer gamma, structural support, and macro channel boundaries converge near $510–$520. This is a coiling phase — ideal for traders who wait for directional confirmation.
If bulls defend $510 and push above $520, it could trigger a controlled gamma squeeze toward $528–$535. But failure to reclaim $517 early week keeps the chart in a chop zone, risking a slow drift back to $505 support.
I’m watching for false liquidity sweeps near $511–$512, which could trap bears before a sharp reversal higher. The reaction to this level will likely define MSFT’s tone for the rest of the week.
Disclaimer: This analysis is for educational purposes only and does not constitute financial advice. Always do your own research and manage risk appropriately.
🟩 Daily Timeframe – Macro Market Structure
Microsoft’s daily chart remains technically bullish in the larger structure but has clearly lost short-term momentum after peaking in late September. Price is now hovering near the lower boundary of its ascending channel, testing the $510 zone — a crucial level for trend continuation.
The ascending channel from early 2024 remains intact, but a break below $507–$505 could trigger a deeper retracement toward the next structural demand zone around $492–$495. On the other hand, a clean bounce from this area could reestablish upside momentum back to $535–$555, aligning with the upper channel resistance.
MACD remains weak with histogram bars printing below the zero line, showing fading bullish energy. Meanwhile, the Stoch RSI is deeply oversold — signaling that momentum is stretched to the downside and a short-term bounce could soon emerge.
This is a make-or-break zone for bulls: defend $510, and we likely see a mean reversion push higher; lose it, and bears gain control toward $495.
🟦 1-Hour Timeframe – Short-Term Trend and Liquidity Shifts
The 1-hour chart reveals a tactical CHoCH → BOS sequence, suggesting buyers are trying to rebuild structure from the intraday low near $504. Price reclaimed minor structure with a BOS at $511, now holding within the $514–$517 resistance box — an area where liquidity previously flipped.
Key observations:
* CHoCH at $504 followed by BOS above $511, signaling short-term bullish intent.
* 9 EMA crossing above 21 EMA — slope slightly upward, confirming near-term bullish pressure.
* MACD histogram turning positive, showing momentum recovering after a multi-day decline.
* RSI hovering near mid-50s — balanced, with room to expand higher.
For Monday–Tuesday, $511.5–$512 remains the key pivot. If price sustains above it with volume, next upside magnet sits at $517–$520. Failure there likely invites another retest toward $507 support.
🟨 15-Minute Timeframe – Intraday Playbook and Micro Structure
The 15-minute chart captures microstructure perfectly. Multiple CHoCH → BOS patterns have appeared within a rising intraday wedge from $506 → $516. This shows strong liquidity cycling between these levels — smart money likely rotating positions around the $514–$515 supply block.
Current setup:
* The latest BOS pushed price into $516.5, but a CHoCH printed immediately after, hinting at short-term exhaustion.
* Price is now compressing between $511.5 (support) and $516 (resistance) — forming a tight scalp zone.
* MACD on the 15-min is fading, showing weaker follow-through after the morning push.
* Stoch RSI curling down from overbought, suggesting intraday pullback risk before any further upside attempt.
If price breaks above $516.8, momentum could accelerate toward $520–$522. Otherwise, expect a short-term dip to $511 before bulls reattempt another leg higher.
🟥 GEX (Gamma Exposure) & Options Sentiment – Dealer Positioning Map
The GEX map gives a clear picture of the current battleground:
* Highest positive gamma / call resistance: $520–$528, where dealers will likely sell into rallies.
* Highest negative gamma / put support: $510, aligning perfectly with the structural support on your daily and 1H charts.
* Large call walls: $525–$535, indicating upside friction where hedging could mute rallies.
* Put walls: $495–$490, aligning with the downside liquidity zone.
* Max Pain: near $510, meaning price may stay magnetized to this level early in the week.
Implied volatility is stable — IVR 34.2 and IVx average 29.9, signaling that options markets are not pricing extreme movement yet. This supports a range-trading bias early week, likely between $510–$520 before volatility expands later.
Dealers currently hold slightly positive gamma, meaning dips will attract buy hedging and limit deep selloffs. If price breaks above $520, gamma flips bearish — expect volatility expansion as dealers hedge short deltas.
🎯 Trade Scenarios
Bullish Setup 🟢
* Entry: Above $516.5–$517 after confirmation candle.
* Target: $520 → $525.
* Stop-loss: Below $511 (or trailing under EMA crossover).
* Confluence: MACD expansion and RSI > 60 on 15M and 1H.
Bearish Setup 🔴
* Entry: On rejection from $517–$520 or breakdown below $511.
* Target: $507 → $495.
* Stop-loss: Above $521.5.
* Confluence: MACD histogram turning negative + RSI < 45.
🧭 Closing Outlook – Week of Oct 21–25
Microsoft is entering a tight volatility pocket where dealer gamma, structural support, and macro channel boundaries converge near $510–$520. This is a coiling phase — ideal for traders who wait for directional confirmation.
If bulls defend $510 and push above $520, it could trigger a controlled gamma squeeze toward $528–$535. But failure to reclaim $517 early week keeps the chart in a chop zone, risking a slow drift back to $505 support.
I’m watching for false liquidity sweeps near $511–$512, which could trap bears before a sharp reversal higher. The reaction to this level will likely define MSFT’s tone for the rest of the week.
Disclaimer: This analysis is for educational purposes only and does not constitute financial advice. Always do your own research and manage risk appropriately.
Declinazione di responsabilità
Le informazioni e le pubblicazioni non sono intese come, e non costituiscono, consulenza o raccomandazioni finanziarie, di investimento, di trading o di altro tipo fornite o approvate da TradingView. Per ulteriori informazioni, consultare i Termini di utilizzo.
Declinazione di responsabilità
Le informazioni e le pubblicazioni non sono intese come, e non costituiscono, consulenza o raccomandazioni finanziarie, di investimento, di trading o di altro tipo fornite o approvate da TradingView. Per ulteriori informazioni, consultare i Termini di utilizzo.