🚀Intraday View (15-Min Chart)
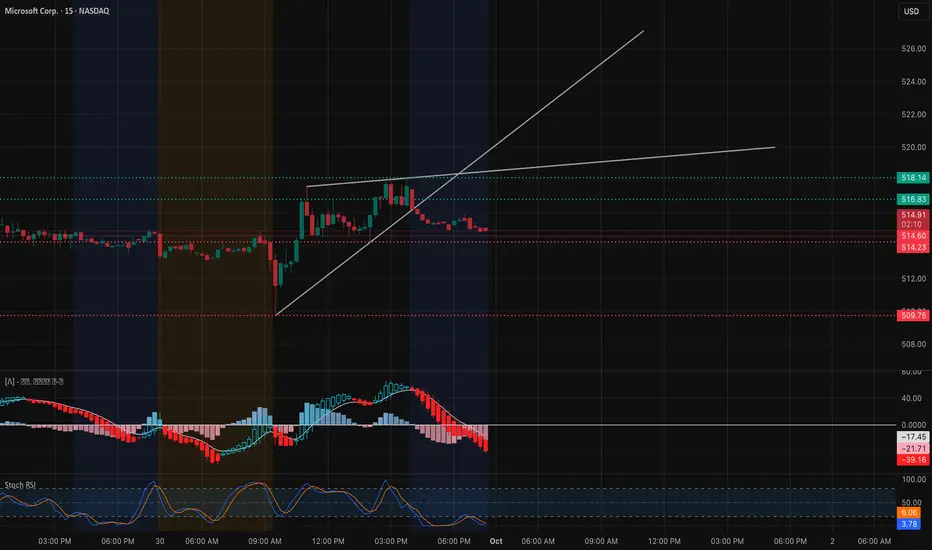
MSFT opened strong but momentum cooled into the close. Price is consolidating just above $514 support, with rejection near $518 showing sellers stepping in. The short-term trendline has already broken.
* Support Levels: $514.20, $509.75
* Resistance Levels: $516.80, $518.14
* Indicators: MACD is firmly red with downside momentum. Stoch RSI is bottoming, hinting at a possible oversold bounce.
📌 Intraday Thought: Watch $514 — if it holds, bounce potential back to $516.8–$518. A break below exposes $510. Scalpers can trade the $514 support bounce with tight stops, or fade $518 if retested.
Options & Swing View (1H + GEX)

The Gamma map is clear:
* Call positioning: Heavy between $522–$530, with a big wall at $524.
* Put support: Strong around $507–$505.
This sets up a coil between $514–$524. A breakout over $524 could fuel a gamma squeeze toward $530+, while failure at $514 risks a drop back to $507.
* Bullish Play: Debit call spread targeting $524 → $530 if $518 reclaims with volume.
* Bearish Hedge: Short-dated puts toward $514 → $507 if support cracks.
* Neutral Play: Iron condor between $507–$524 to capture premium while MSFT stays pinned.
My thoughts:
MSFT is gearing up for volatility into October. Intraday pressure favors caution, but the GEX landscape signals explosive potential if $524 breaks. Best approach: scalp intraday ranges, but keep eyes on $524 breakout vs. $507 breakdown for swing setups.
Disclaimer: This analysis is for educational purposes only and does not constitute financial advice. Always do your own research and manage risk before trading.
MSFT opened strong but momentum cooled into the close. Price is consolidating just above $514 support, with rejection near $518 showing sellers stepping in. The short-term trendline has already broken.
* Support Levels: $514.20, $509.75
* Resistance Levels: $516.80, $518.14
* Indicators: MACD is firmly red with downside momentum. Stoch RSI is bottoming, hinting at a possible oversold bounce.
📌 Intraday Thought: Watch $514 — if it holds, bounce potential back to $516.8–$518. A break below exposes $510. Scalpers can trade the $514 support bounce with tight stops, or fade $518 if retested.
Options & Swing View (1H + GEX)
The Gamma map is clear:
* Call positioning: Heavy between $522–$530, with a big wall at $524.
* Put support: Strong around $507–$505.
This sets up a coil between $514–$524. A breakout over $524 could fuel a gamma squeeze toward $530+, while failure at $514 risks a drop back to $507.
* Bullish Play: Debit call spread targeting $524 → $530 if $518 reclaims with volume.
* Bearish Hedge: Short-dated puts toward $514 → $507 if support cracks.
* Neutral Play: Iron condor between $507–$524 to capture premium while MSFT stays pinned.
My thoughts:
MSFT is gearing up for volatility into October. Intraday pressure favors caution, but the GEX landscape signals explosive potential if $524 breaks. Best approach: scalp intraday ranges, but keep eyes on $524 breakout vs. $507 breakdown for swing setups.
Disclaimer: This analysis is for educational purposes only and does not constitute financial advice. Always do your own research and manage risk before trading.
Declinazione di responsabilità
Le informazioni e le pubblicazioni non sono intese come, e non costituiscono, consulenza o raccomandazioni finanziarie, di investimento, di trading o di altro tipo fornite o approvate da TradingView. Per ulteriori informazioni, consultare i Termini di utilizzo.
Declinazione di responsabilità
Le informazioni e le pubblicazioni non sono intese come, e non costituiscono, consulenza o raccomandazioni finanziarie, di investimento, di trading o di altro tipo fornite o approvate da TradingView. Per ulteriori informazioni, consultare i Termini di utilizzo.