Watching $520 Support and $525 Breakout Zone ⚙️
1. Market Structure (1H & 15M)
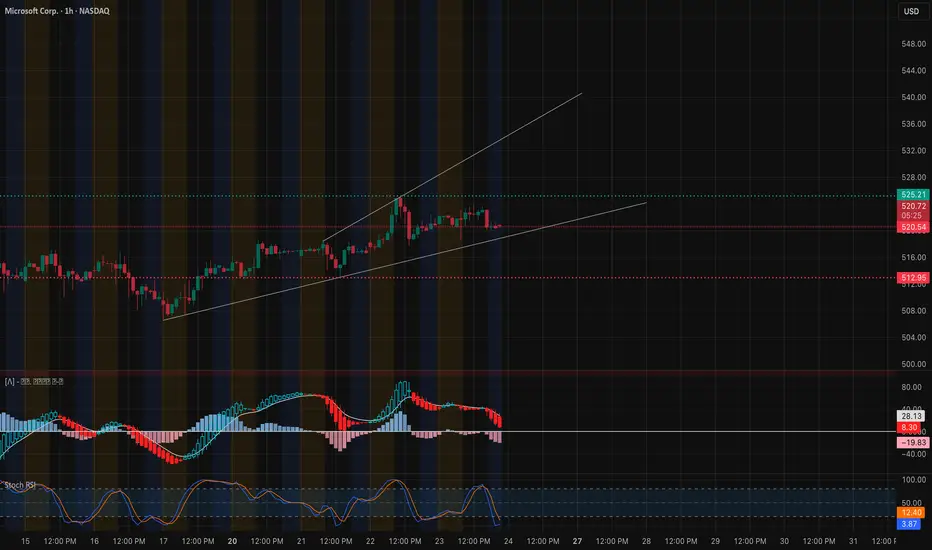
Microsoft (MSFT) continues to respect a rising structure but is now entering a compression phase under a strong resistance shelf near $525. On the 1-hour chart, the trend remains intact above the ascending trendline that started around $510. Recent CHoCH and BOS rotations highlight a healthy bullish structure, but the candles show indecision as the price tightens between $518–$523.
On the 15-minute chart, MSFT is consolidating inside a symmetrical triangle — a pattern that often precedes expansion. Price made a small CHoCH near $518 but quickly reclaimed $520, showing bulls are still defending short-term structure. The market’s behavior suggests buyers are absorbing dips, though momentum is cooling slightly before a potential Friday decision move.

2. Supply and Demand / Order Blocks
* Demand Zone (Support): $512–$515 — strong institutional footprint and previous BOS area. This zone also aligns with the HVL (high-volume level) and should act as the main support to watch.
* Near-Term Demand: $518–$519 — local demand zone where the 1H trendline intersects.
* Supply Zone (Resistance): $523–$526 — overlapping BOS top and GEX call wall region. A clean break and hold above this would confirm bullish continuation toward $530+.
Overall structure suggests that MSFT is in mid-cycle consolidation. Bulls need to push through $525 to regain dominance, while bears will likely press if $518 fails.
3. Indicator Confluence
* 9 EMA / 21 EMA: On both 1H and 15M charts, MSFT is hugging the EMAs closely. The 9 EMA is flattening slightly, signaling equilibrium. A crossover back upward on the 15M could kick off a premarket breakout if volume returns.
* MACD: The 1H MACD is currently cooling off after an extended bullish run — histogram fading, but the fast line remains above zero, meaning trend momentum is intact. On the 15M, MACD is near reset, suggesting potential for a new impulse wave if buyers regain control.
* RSI: The 1H RSI sits around 52 — neutral and balanced, reflecting the compression. The 15M RSI near 45 shows a short-term cooldown phase, but not yet oversold.
* Volume: Volume has declined during this consolidation, a typical pre-breakout setup where traders await confirmation.
4. GEX (Gamma Exposure) & Options Sentiment

The GEX chart reveals a crucial battle between $510 (put support) and $525 (call resistance). The highest positive gamma concentration sits around $523–$525, forming the main resistance zone. Above this, open gamma levels thin out until $530+, suggesting a quick acceleration could follow if that level breaks.
Below, PUT support clusters at $510–$512, acting as a strong floor. This gamma structure aligns perfectly with the technical zones, making $518–$525 the key range where dealer hedging and price magnetization are likely strongest.
IVR at 29.1 and IVX avg 30.9 (-0.37%) indicate compressed volatility, again pointing toward an upcoming expansion move. Options flow leans 20.4% CALLS, which is moderate and reflects traders waiting for confirmation before loading on one side.
A breakout through $525 could trigger hedging flow toward $530–$535, while failure to hold $518 could send price to retest the $512–$510 support band.
5. Trade Scenarios for Friday, Oct. 24
Bullish Setup 🟩
* Entry Zone: $518–$520 retest or breakout above $523.8
* Targets: $526 → $530 → $535
* Stop-Loss: Below $516.5
* Confirmation: Hold above 9 EMA on 15M, MACD green crossover, RSI > 55
Bearish Setup 🟥
* Entry Zone: Rejection from $523–$525 or breakdown under $518
* Targets: $515 → $512 → $510
* Stop-Loss: Above $525.8
* Confirmation: CHoCH + MACD crossdown + RSI < 45
6. Closing Outlook for Oct. 24 (Friday)
Friday’s setup for MSFT is balanced but primed for breakout. The chart structure, EMAs, and gamma data all point to tight compression between $518 and $525 — a range that will likely resolve directionally before next week’s earnings-driven volatility window.
If bulls push through $525, momentum could accelerate quickly toward $530–$535 fueled by gamma shifts and short-term call delta hedging. Conversely, a failure to defend $518 may bring a controlled retest of $512–$510, where fresh liquidity likely sits.
My personal bias: MSFT remains constructive, with the larger structure favoring an eventual breakout to the upside — but only if $518 holds firm overnight.
💬 Final Thought: “MSFT is tightening between $518 and $525 — this is a coiled spring setup. A breakout above $525 could rip through $530 fast, while $518 remains the critical line for bulls to defend.”
This analysis is for educational purposes only and not financial advice. Always do your own research and manage your risk before trading.
1. Market Structure (1H & 15M)
Microsoft (MSFT) continues to respect a rising structure but is now entering a compression phase under a strong resistance shelf near $525. On the 1-hour chart, the trend remains intact above the ascending trendline that started around $510. Recent CHoCH and BOS rotations highlight a healthy bullish structure, but the candles show indecision as the price tightens between $518–$523.
On the 15-minute chart, MSFT is consolidating inside a symmetrical triangle — a pattern that often precedes expansion. Price made a small CHoCH near $518 but quickly reclaimed $520, showing bulls are still defending short-term structure. The market’s behavior suggests buyers are absorbing dips, though momentum is cooling slightly before a potential Friday decision move.
2. Supply and Demand / Order Blocks
* Demand Zone (Support): $512–$515 — strong institutional footprint and previous BOS area. This zone also aligns with the HVL (high-volume level) and should act as the main support to watch.
* Near-Term Demand: $518–$519 — local demand zone where the 1H trendline intersects.
* Supply Zone (Resistance): $523–$526 — overlapping BOS top and GEX call wall region. A clean break and hold above this would confirm bullish continuation toward $530+.
Overall structure suggests that MSFT is in mid-cycle consolidation. Bulls need to push through $525 to regain dominance, while bears will likely press if $518 fails.
3. Indicator Confluence
* 9 EMA / 21 EMA: On both 1H and 15M charts, MSFT is hugging the EMAs closely. The 9 EMA is flattening slightly, signaling equilibrium. A crossover back upward on the 15M could kick off a premarket breakout if volume returns.
* MACD: The 1H MACD is currently cooling off after an extended bullish run — histogram fading, but the fast line remains above zero, meaning trend momentum is intact. On the 15M, MACD is near reset, suggesting potential for a new impulse wave if buyers regain control.
* RSI: The 1H RSI sits around 52 — neutral and balanced, reflecting the compression. The 15M RSI near 45 shows a short-term cooldown phase, but not yet oversold.
* Volume: Volume has declined during this consolidation, a typical pre-breakout setup where traders await confirmation.
4. GEX (Gamma Exposure) & Options Sentiment
The GEX chart reveals a crucial battle between $510 (put support) and $525 (call resistance). The highest positive gamma concentration sits around $523–$525, forming the main resistance zone. Above this, open gamma levels thin out until $530+, suggesting a quick acceleration could follow if that level breaks.
Below, PUT support clusters at $510–$512, acting as a strong floor. This gamma structure aligns perfectly with the technical zones, making $518–$525 the key range where dealer hedging and price magnetization are likely strongest.
IVR at 29.1 and IVX avg 30.9 (-0.37%) indicate compressed volatility, again pointing toward an upcoming expansion move. Options flow leans 20.4% CALLS, which is moderate and reflects traders waiting for confirmation before loading on one side.
A breakout through $525 could trigger hedging flow toward $530–$535, while failure to hold $518 could send price to retest the $512–$510 support band.
5. Trade Scenarios for Friday, Oct. 24
Bullish Setup 🟩
* Entry Zone: $518–$520 retest or breakout above $523.8
* Targets: $526 → $530 → $535
* Stop-Loss: Below $516.5
* Confirmation: Hold above 9 EMA on 15M, MACD green crossover, RSI > 55
Bearish Setup 🟥
* Entry Zone: Rejection from $523–$525 or breakdown under $518
* Targets: $515 → $512 → $510
* Stop-Loss: Above $525.8
* Confirmation: CHoCH + MACD crossdown + RSI < 45
6. Closing Outlook for Oct. 24 (Friday)
Friday’s setup for MSFT is balanced but primed for breakout. The chart structure, EMAs, and gamma data all point to tight compression between $518 and $525 — a range that will likely resolve directionally before next week’s earnings-driven volatility window.
If bulls push through $525, momentum could accelerate quickly toward $530–$535 fueled by gamma shifts and short-term call delta hedging. Conversely, a failure to defend $518 may bring a controlled retest of $512–$510, where fresh liquidity likely sits.
My personal bias: MSFT remains constructive, with the larger structure favoring an eventual breakout to the upside — but only if $518 holds firm overnight.
💬 Final Thought: “MSFT is tightening between $518 and $525 — this is a coiled spring setup. A breakout above $525 could rip through $530 fast, while $518 remains the critical line for bulls to defend.”
This analysis is for educational purposes only and not financial advice. Always do your own research and manage your risk before trading.
Declinazione di responsabilità
Le informazioni e le pubblicazioni non sono intese come, e non costituiscono, consulenza o raccomandazioni finanziarie, di investimento, di trading o di altro tipo fornite o approvate da TradingView. Per ulteriori informazioni, consultare i Termini di utilizzo.
Declinazione di responsabilità
Le informazioni e le pubblicazioni non sono intese come, e non costituiscono, consulenza o raccomandazioni finanziarie, di investimento, di trading o di altro tipo fornite o approvate da TradingView. Per ulteriori informazioni, consultare i Termini di utilizzo.