🕰 Weekly View (Big Picture)
The Elliott Wave structure is playing out cleanly:
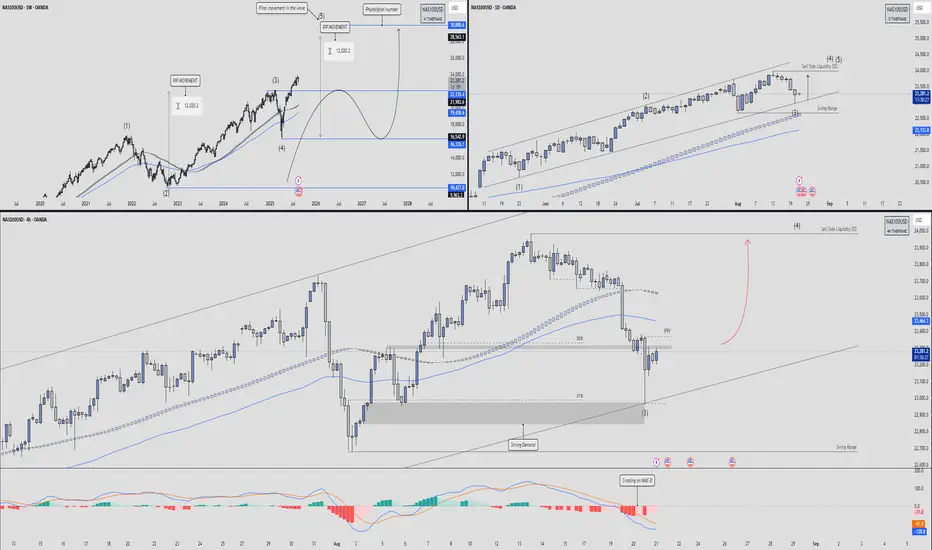
Wave (1) topped → Wave (2) corrective pullback.
Wave (3) extended strongly, now we’re inside Wave (5).
Price is showing final movement within the wave cycle, meaning the index is likely topping out.
A measured move of ~12,000 pips matches the symmetry between Waves (1–3) and (3–5).
Key downside retracement zones:
21,133 – 19,736 → first major support block.
16,352 – 16,351 → deeper retracement zone if momentum collapses.
Ultimate liquidity magnet sits around 10,427, but that’s long-term.
📉 Daily Structure
Market traded inside a rising channel, with the last leg forming Wave (5).
Current price action is rejecting sell-side liquidity, hinting at weakness.
Breakdown of the swing range → momentum shift underway.
Strong support rests near 22,133, aligning with the 200 EMA cluster.
Loss of that level = higher probability of completing Wave (4) retracement.
⏱ 4H Breakdown
The 4H chart shows the short-term battle:
Price wicked into the 71% retracement and tapped strong demand.
Currently consolidating inside a corrective bounce zone.
The 50% retracement and IPH level (~23,450) act as immediate resistance.
Expectation:
If supply holds, we rotate lower to re-test demand at 23,000 – 22,800.
If buyers defend, a relief push into 23,600 – 23,800 is possible before selling resumes.
🎯 Trade Plan
Bias: Short-to-mid term bearish (retracement phase of Wave (5)).
Entry Zone: Look for rejection around 23,450 – 23,600.
Target Zones:
First take profit → 23,000 – 22,800 demand.
Secondary target → 22,133 swing level.
Invalidation: A clean break and hold above 23,800 – 24,000 would re-open bullish continuation.
Risk Management: Trade within the channel structure, size down due to volatility.
The Elliott Wave structure is playing out cleanly:
Wave (1) topped → Wave (2) corrective pullback.
Wave (3) extended strongly, now we’re inside Wave (5).
Price is showing final movement within the wave cycle, meaning the index is likely topping out.
A measured move of ~12,000 pips matches the symmetry between Waves (1–3) and (3–5).
Key downside retracement zones:
21,133 – 19,736 → first major support block.
16,352 – 16,351 → deeper retracement zone if momentum collapses.
Ultimate liquidity magnet sits around 10,427, but that’s long-term.
📉 Daily Structure
Market traded inside a rising channel, with the last leg forming Wave (5).
Current price action is rejecting sell-side liquidity, hinting at weakness.
Breakdown of the swing range → momentum shift underway.
Strong support rests near 22,133, aligning with the 200 EMA cluster.
Loss of that level = higher probability of completing Wave (4) retracement.
⏱ 4H Breakdown
The 4H chart shows the short-term battle:
Price wicked into the 71% retracement and tapped strong demand.
Currently consolidating inside a corrective bounce zone.
The 50% retracement and IPH level (~23,450) act as immediate resistance.
Expectation:
If supply holds, we rotate lower to re-test demand at 23,000 – 22,800.
If buyers defend, a relief push into 23,600 – 23,800 is possible before selling resumes.
🎯 Trade Plan
Bias: Short-to-mid term bearish (retracement phase of Wave (5)).
Entry Zone: Look for rejection around 23,450 – 23,600.
Target Zones:
First take profit → 23,000 – 22,800 demand.
Secondary target → 22,133 swing level.
Invalidation: A clean break and hold above 23,800 – 24,000 would re-open bullish continuation.
Risk Management: Trade within the channel structure, size down due to volatility.
Declinazione di responsabilità
Le informazioni ed i contenuti pubblicati non costituiscono in alcun modo una sollecitazione ad investire o ad operare nei mercati finanziari. Non sono inoltre fornite o supportate da TradingView. Maggiori dettagli nelle Condizioni d'uso.
Declinazione di responsabilità
Le informazioni ed i contenuti pubblicati non costituiscono in alcun modo una sollecitazione ad investire o ad operare nei mercati finanziari. Non sono inoltre fornite o supportate da TradingView. Maggiori dettagli nelle Condizioni d'uso.