Long
NASDAQ Up!

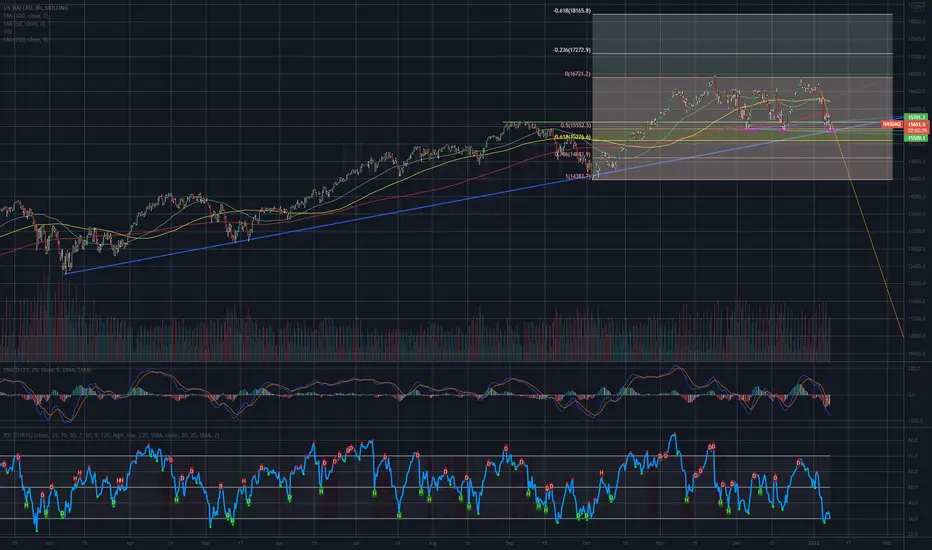
Nasdaq should grow from here.
- Triple Bottom (see purple drawings)
- Long term vertical support (blue line)
- Short term horizontal support (green line)
- TLT made a breakout downwards (usually inversely correlated with indices)
- Fibonacci 50% hit
- Bullish divergence on RSI (we had a lower low on the candle, but RSI was higher compared to lower candle before)
I reckon this will go up from here and we could potentially see a new ATH at ~18100 points.
However - we need to wait for confirmation (breakout above orange vertical resistance).
Good luck with your trading.
Declinazione di responsabilità
Le informazioni e le pubblicazioni non sono intese come, e non costituiscono, consulenza o raccomandazioni finanziarie, di investimento, di trading o di altro tipo fornite o approvate da TradingView. Per ulteriori informazioni, consultare i Termini di utilizzo.
Declinazione di responsabilità
Le informazioni e le pubblicazioni non sono intese come, e non costituiscono, consulenza o raccomandazioni finanziarie, di investimento, di trading o di altro tipo fornite o approvate da TradingView. Per ulteriori informazioni, consultare i Termini di utilizzo.