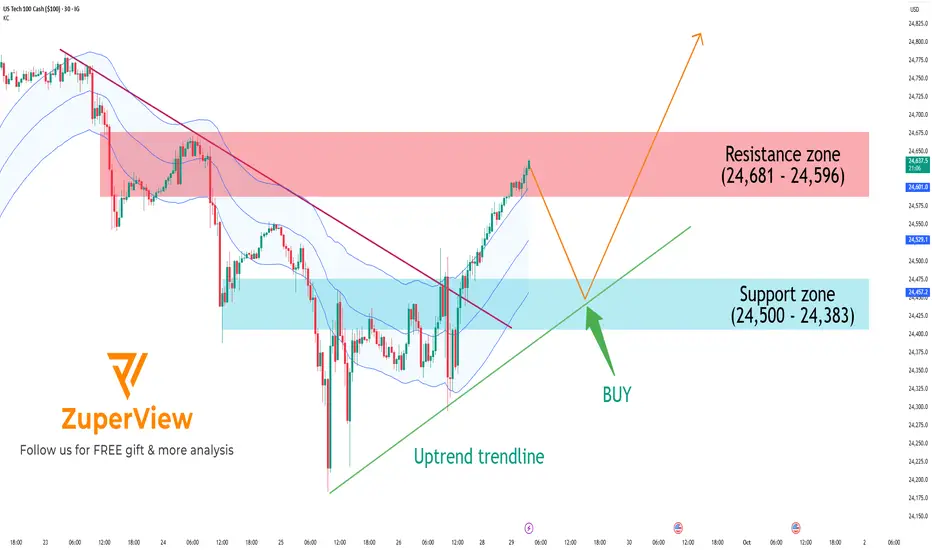
The  NASDAQ has shown a strong short-term recovery after breaking a major descending trendline. However, price is now testing a significant resistance zone, and a technical pullback is likely before the uptrend can continue.
📊 Technical Analysis: 30-minute Chart

📉 1. Overall Trend

🟥 2. Resistance Zone: 24,596 – 24,681

🟦 3. Support Zone: 24,383 – 24,500
🔁 Potential Trade Setups
✳️ Primary Scenario (preferred):
Enter long if support holds:
🎯 TP1: 24,650
🎯 TP2: 24,700+
🛑 SL: Below 24,350 (trendline invalidation)
🔻 Alternative Scenario (risk):
✅ Conclusion
📊 Technical Analysis: 30-minute Chart
📉 1. Overall Trend
- Price has successfully broken above a descending trendline (red line), shifting market structure from bearish to bullish.
- An uptrend line (green) is now acting as dynamic support.
- Price is trading near the upper band of the Keltner Channel, indicating sustained bullish momentum.
🟥 2. Resistance Zone: 24,596 – 24,681
- This zone has acted as a strong supply area in the past, causing multiple rejections.
- Price is currently testing this area again → a rejection or short-term pullback is highly probable.
🟦 3. Support Zone: 24,383 – 24,500
- This zone overlaps with previous consolidation and aligns with the uptrend line.
- If a pullback occurs, this area could attract buyers and act as a launchpad for the next leg up.
🔁 Potential Trade Setups
✳️ Primary Scenario (preferred):
- Price rejects at resistance → pulls back to support → bounces and resumes the uptrend
- Wait for a pullback toward 24,500 – 24,383
- Look for bullish price action (e.g., bullish engulfing, hammer) for entry
Enter long if support holds:
🎯 TP1: 24,650
🎯 TP2: 24,700+
🛑 SL: Below 24,350 (trendline invalidation)
🔻 Alternative Scenario (risk):
- If price breaks below 24,383 and the uptrend line fails → short-term trend could shift sideways or bearish
- Avoid long entries without a confirmed recovery
- Re-evaluate trend structure if support fails
✅ Conclusion
- A short-term uptrend is in place
- However, price is now testing a major resistance zone, and a healthy pullback is likely
Please like and comment below to support our traders. Your reactions will motivate us to do more analysis in the future 🙏✨
Declinazione di responsabilità
Le informazioni e le pubblicazioni non sono intese come, e non costituiscono, consulenza o raccomandazioni finanziarie, di investimento, di trading o di altro tipo fornite o approvate da TradingView. Per ulteriori informazioni, consultare i Termini di utilizzo.
Declinazione di responsabilità
Le informazioni e le pubblicazioni non sono intese come, e non costituiscono, consulenza o raccomandazioni finanziarie, di investimento, di trading o di altro tipo fornite o approvate da TradingView. Per ulteriori informazioni, consultare i Termini di utilizzo.