Technical Analysis Summary:
1. Pattern Breakdown:
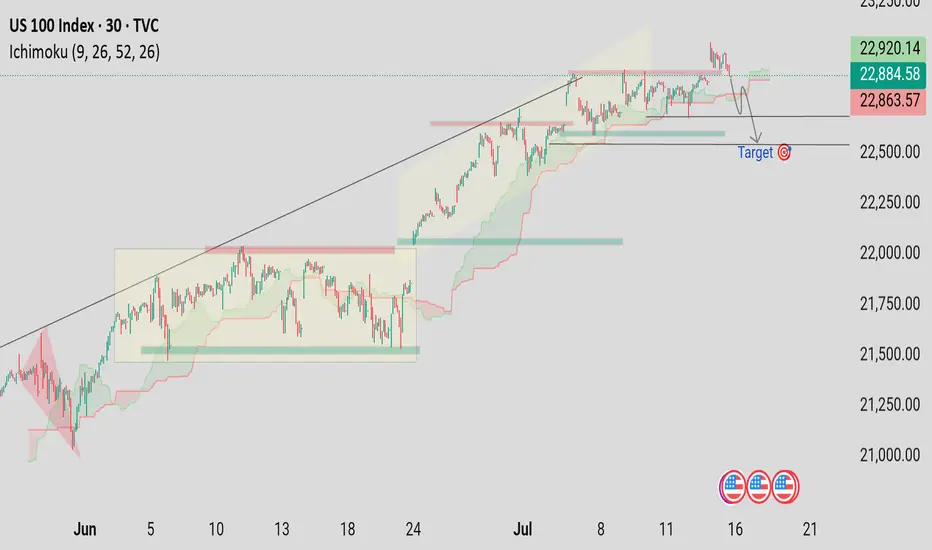
Price has broken below an ascending trendline, signaling weakness after a strong bullish move.
A double-top or distribution phase can be inferred at the recent highs (around 23,100–23,200), confirming buyer exhaustion.
2. Ichimoku Cloud:
The price has dipped into the Ichimoku cloud, indicating indecision or early bearishness.
If it breaks below the cloud, it would confirm a bearish trend continuation.
3. Key Levels:
Resistance: Around 22,920 – 23,200 (recent highs)
Support: Multiple levels observed, but the major target is marked near 22,400.
This aligns with a prior consolidation zone, making it a likely demand area.
4. Price Action:
The projected path (gray line) suggests a potential retest of broken support, followed by a drop toward the 22,400 target.
Current price at 22,884 still offers room to the downside.
5. Volume/Events:
Economic events icons at the bottom (likely U.S. economic news releases) may trigger volatility and either confirm or reject this bearish setup.
---
🔍 Conclusion:
Bias: Bearish short-term
Target: 22,400
Invalidation: A strong move back above 23,000 with bullish momentum
Strategy Suggestion: Watch for a break and close below the Ichimoku cloud, or a lower high rejection for a short entry confirmation.
1. Pattern Breakdown:
Price has broken below an ascending trendline, signaling weakness after a strong bullish move.
A double-top or distribution phase can be inferred at the recent highs (around 23,100–23,200), confirming buyer exhaustion.
2. Ichimoku Cloud:
The price has dipped into the Ichimoku cloud, indicating indecision or early bearishness.
If it breaks below the cloud, it would confirm a bearish trend continuation.
3. Key Levels:
Resistance: Around 22,920 – 23,200 (recent highs)
Support: Multiple levels observed, but the major target is marked near 22,400.
This aligns with a prior consolidation zone, making it a likely demand area.
4. Price Action:
The projected path (gray line) suggests a potential retest of broken support, followed by a drop toward the 22,400 target.
Current price at 22,884 still offers room to the downside.
5. Volume/Events:
Economic events icons at the bottom (likely U.S. economic news releases) may trigger volatility and either confirm or reject this bearish setup.
---
🔍 Conclusion:
Bias: Bearish short-term
Target: 22,400
Invalidation: A strong move back above 23,000 with bullish momentum
Strategy Suggestion: Watch for a break and close below the Ichimoku cloud, or a lower high rejection for a short entry confirmation.
Declinazione di responsabilità
Le informazioni ed i contenuti pubblicati non costituiscono in alcun modo una sollecitazione ad investire o ad operare nei mercati finanziari. Non sono inoltre fornite o supportate da TradingView. Maggiori dettagli nelle Condizioni d'uso.
Declinazione di responsabilità
Le informazioni ed i contenuti pubblicati non costituiscono in alcun modo una sollecitazione ad investire o ad operare nei mercati finanziari. Non sono inoltre fornite o supportate da TradingView. Maggiori dettagli nelle Condizioni d'uso.