🔎 Multi-Timeframe Market Structure
4H Chart
Clear rejection from 24,850–24,900 supply zone.
Strong bearish candle printed after touching upper resistance.
Currently sitting around 24,740, right above an FVG + demand pocket (24,680–24,700).
If this zone breaks, next liquidity rests near 24,550–24,580.
👉 Bias: Neutral to bearish unless price reclaims 24,850 convincingly.
1H Chart
Structure shows a lower high at 24,850 and now pushing into corrective leg.
FVG around 24,700–24,740 is being tested right now.
Below this, structural support rests at 24,600 (trendline + OB zone).
👉 Bias: Watching if demand at 24,700 holds. If not, momentum could accelerate down.
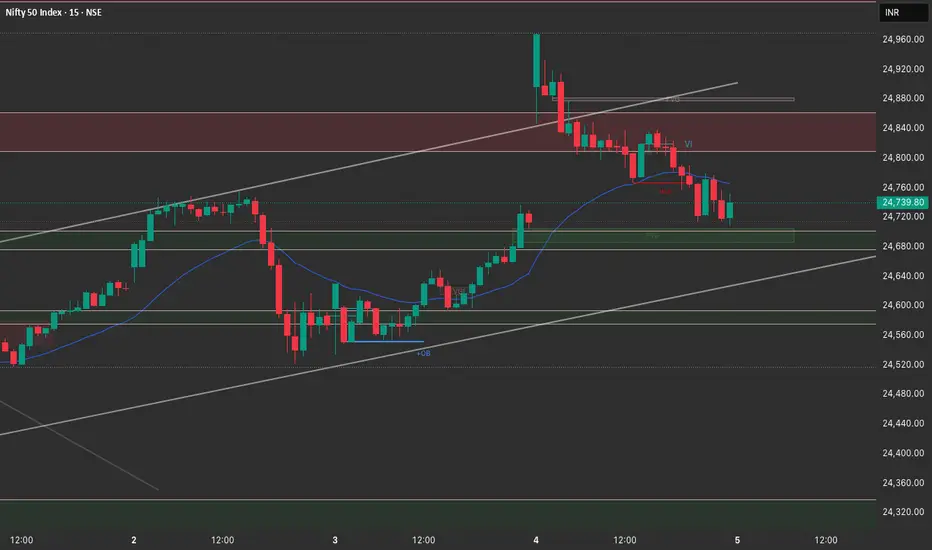
15M Chart
Market created a breaker structure (MSS) at 24,820 → confirms intraday bearishness.
Current candles consolidating around 24,720–24,740 demand.
Liquidity sits below 24,680. If swept, expect sharp reaction (either bounce or further sell-off).
👉 Bias: Short-term consolidation → either bounce back to 24,800 or flush toward 24,600.
🎯 Trade Plan for 5th September
Long Setup
Entry: 24,700–24,720 demand sweep.
Stoploss: Below 24,640.
Targets:
T1: 24,800 (immediate FVG fill)
T2: 24,850–24,880 (supply)
⚠️ Works only if price protects 24,700 demand.
Short Setup
Entry 1: On rejection from 24,800–24,850 zone.
Entry 2: Breakdown below 24,680 demand.
Stoploss: Above 24,880 (for Entry 1) / Above 24,720 (for Entry 2).
Targets:
T1: 24,600 (OB + liquidity)
T2: 24,500 (deeper demand zone)
✅ Key Pivot Levels for 5th Sept
Bullish Protection: 24,700
Bullish Trigger: 24,850
Bearish Trigger: 24,680
Bearish Extension: 24,600 → 24,500
4H Chart
Clear rejection from 24,850–24,900 supply zone.
Strong bearish candle printed after touching upper resistance.
Currently sitting around 24,740, right above an FVG + demand pocket (24,680–24,700).
If this zone breaks, next liquidity rests near 24,550–24,580.
👉 Bias: Neutral to bearish unless price reclaims 24,850 convincingly.
1H Chart
Structure shows a lower high at 24,850 and now pushing into corrective leg.
FVG around 24,700–24,740 is being tested right now.
Below this, structural support rests at 24,600 (trendline + OB zone).
👉 Bias: Watching if demand at 24,700 holds. If not, momentum could accelerate down.
15M Chart
Market created a breaker structure (MSS) at 24,820 → confirms intraday bearishness.
Current candles consolidating around 24,720–24,740 demand.
Liquidity sits below 24,680. If swept, expect sharp reaction (either bounce or further sell-off).
👉 Bias: Short-term consolidation → either bounce back to 24,800 or flush toward 24,600.
🎯 Trade Plan for 5th September
Long Setup
Entry: 24,700–24,720 demand sweep.
Stoploss: Below 24,640.
Targets:
T1: 24,800 (immediate FVG fill)
T2: 24,850–24,880 (supply)
⚠️ Works only if price protects 24,700 demand.
Short Setup
Entry 1: On rejection from 24,800–24,850 zone.
Entry 2: Breakdown below 24,680 demand.
Stoploss: Above 24,880 (for Entry 1) / Above 24,720 (for Entry 2).
Targets:
T1: 24,600 (OB + liquidity)
T2: 24,500 (deeper demand zone)
✅ Key Pivot Levels for 5th Sept
Bullish Protection: 24,700
Bullish Trigger: 24,850
Bearish Trigger: 24,680
Bearish Extension: 24,600 → 24,500
Declinazione di responsabilità
Le informazioni e le pubblicazioni non sono intese come, e non costituiscono, consulenza o raccomandazioni finanziarie, di investimento, di trading o di altro tipo fornite o approvate da TradingView. Per ulteriori informazioni, consultare i Termini di utilizzo.
Declinazione di responsabilità
Le informazioni e le pubblicazioni non sono intese come, e non costituiscono, consulenza o raccomandazioni finanziarie, di investimento, di trading o di altro tipo fornite o approvate da TradingView. Per ulteriori informazioni, consultare i Termini di utilizzo.