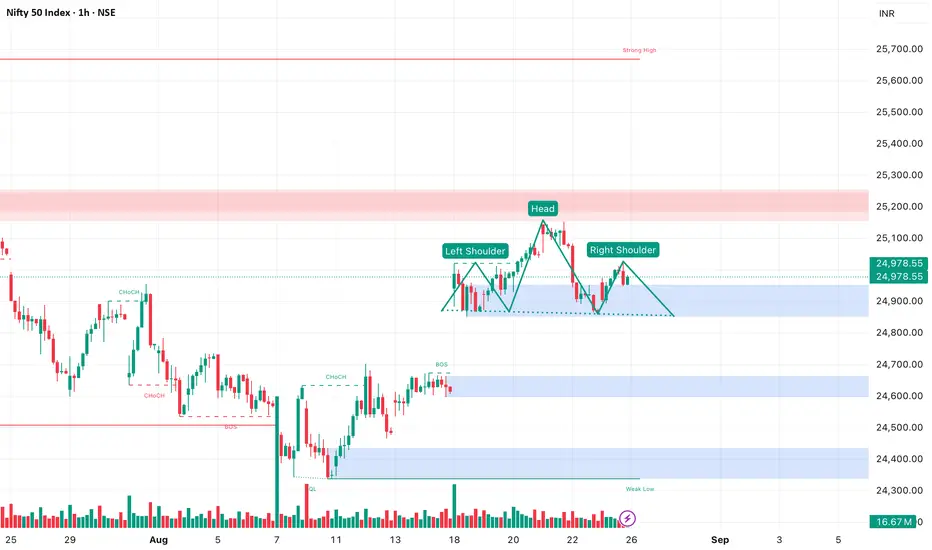
Nifty on the 1H timeframe is showing signs of a possible Head & Shoulders formation, which could indicate a short-term reversal if the neckline breaks. Currently, price action is between neckline and the right shoulder. Traders should watch the neckline level closely for confirmation.
📌 Key Note: There’s also an unfilled gap left around the 22,660–24,850 zone, which may act as a magnet for price action after H&S neckline breakout.
⚠️ This is not financial advice — just my personal market observation. Manage risk accordingly.
#Nifty #Nifty50 #TechnicalAnalysis #HeadAndShoulders #PriceAction #GapTrading #NSEIndia #StockMarketIndia #IndexTrading #ChartPatterns #SwingTrading
Declinazione di responsabilità
Le informazioni ed i contenuti pubblicati non costituiscono in alcun modo una sollecitazione ad investire o ad operare nei mercati finanziari. Non sono inoltre fornite o supportate da TradingView. Maggiori dettagli nelle Condizioni d'uso.
Declinazione di responsabilità
Le informazioni ed i contenuti pubblicati non costituiscono in alcun modo una sollecitazione ad investire o ad operare nei mercati finanziari. Non sono inoltre fornite o supportate da TradingView. Maggiori dettagli nelle Condizioni d'uso.