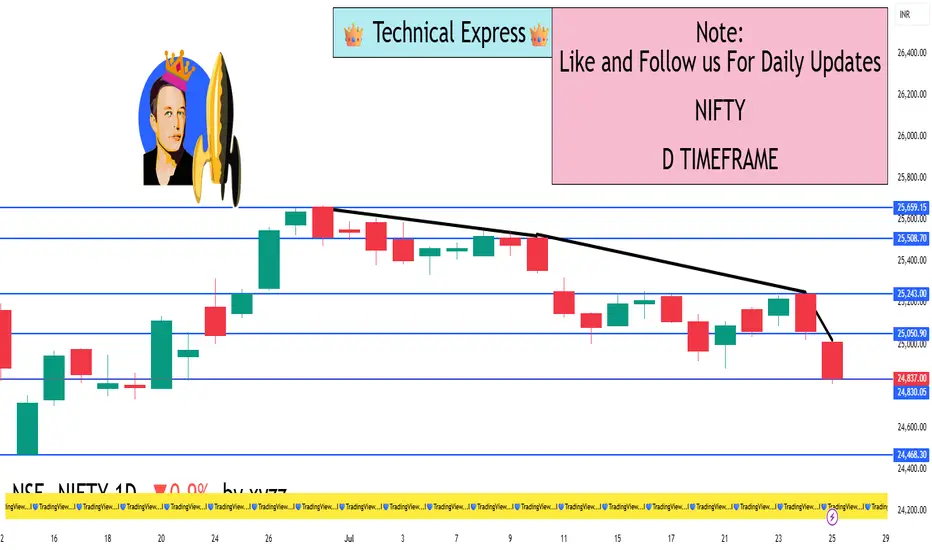
Closing Price: 24,837.00
Net Change: −225.10 points (−0.90%)
Opening: 24,981.35
High: 25,008.90
Low: 24,770.85
Trend: Bearish
📊 Technical Overview
✅ Candle Type:
Bearish candle formed with a long body and small wicks.
Indicates strong selling pressure throughout the day.
🔻 Support Zones:
24,750 – Immediate support (tested on 25 July)
24,600 – Stronger support zone
24,400 – Medium-term support from early July
🔺 Resistance Zones:
24,900 – Immediate resistance
25,000 – Psychological resistance
25,150–25,300 – Strong resistance zone
📈 Indicators Summary:
RSI: Likely near 45 – showing weakening momentum
MACD: Bearish crossover continues – indicating downward trend
Volume: Slightly higher than average – confirms active selling
🧠 Market Sentiment:
Sentiment remains cautious and bearish.
Selling seen in major sectors like Auto, Energy, FMCG, and Banking.
Only Pharma showed relative strength.
Global cues and foreign investor selling weighed on market sentiment.
This marks the fourth straight weekly loss for the Nifty index.
✅ Conclusion:
Nifty is in a short-term downtrend, unable to sustain above 25,000.
If 24,750 is broken decisively, the next target could be 24,600 or lower.
Bulls must reclaim and hold above 25,000–25,150 to reverse the sentiment.
I built a Buy & Sell Signal Indicator with 85% accuracy.
📈 Get access via DM or
WhatsApp: wa.link/d997q0
Contact - +91 76782 40962
| Email: techncialexpress@gmail.com
| Script Coder | Trader | Investor | From India
📈 Get access via DM or
WhatsApp: wa.link/d997q0
Contact - +91 76782 40962
| Email: techncialexpress@gmail.com
| Script Coder | Trader | Investor | From India
Pubblicazioni correlate
Declinazione di responsabilità
The information and publications are not meant to be, and do not constitute, financial, investment, trading, or other types of advice or recommendations supplied or endorsed by TradingView. Read more in the Terms of Use.