Hello Everyone,
Just wanted to update on what's happening in Nifty50. Couldn't get time to put together a bit early( other works) . Anyway.....lets start. This is just my idea, views can and will differ.
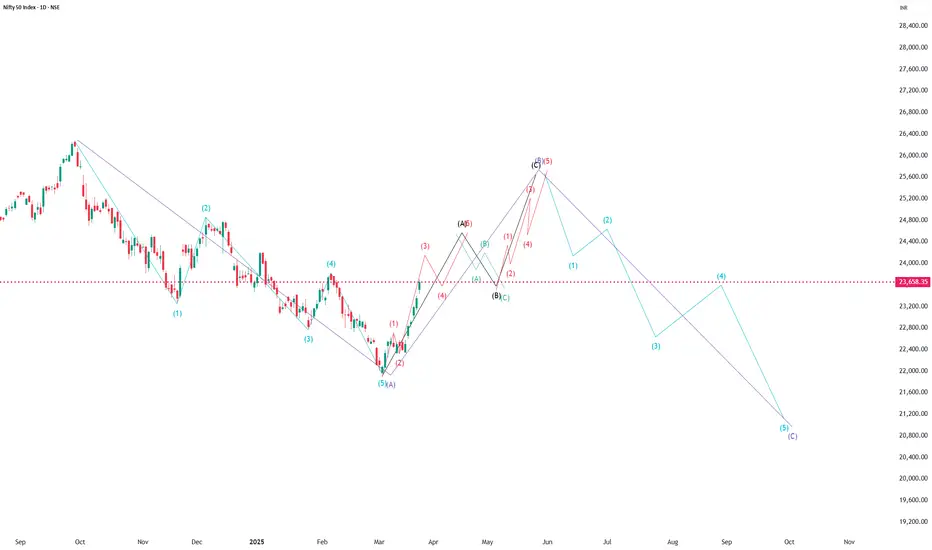
As per our previous view, market bounced somewhere from ~21970 levels but its getting unfolded as an impulse wave...so the party is over for downside and sub wave A in ABC corrective wave is over. one wave is done ( corrective wave against the major trend which started from March 2020)
We are currently in wave B. Some people might be wondering how this sub wave B will unfold and some might even be thinking that downside is over as we are seeing an impulse wave and may hit ATH soon blah blah blah...
----------------------------------------------------------------------
First thing first always sharing knowledge.
Motive waves
Impulse or diagonal wave or Impulse with extensions
- Impulse is a 1-2-3-4-5 pattern where sub wave 3 is bigger.
- Diagonal is a 1-2-3-4-5 pattern where sub wave 1 ( wave 1 > wave 3 > wave 5 ) or
sub wave 5 ( wave 1 < wave 3 < wave 5 ) is bigger. Further classified into leading diagonal
and ending diagonal. Check online for more info or my previous post. saving my writing time.
- Extension is a 1-2-3-4-5 pattern similar to impulse but we will see one more (1-2-3-4-5)
inside wave 1 or wave 3 or wave 5.
Corrective waves
We have Zigzag (5-3-5) , Flat ( 3-3-5) , Triangle ( 3-3-3-3-3) , double 2 and double 3 as the corrective wave structures. Any where you see, these are the ones that unfold .
Lets see what market has done till now
Down move (Completed) (27th Sep 2024 - 4th March 2025)
Since its against the trend ( which started from covid time) market has to unfold in ABC pattern which is nothing but correction. This is over, we saw a "Contracting leading diagonal" . Leading diagonals always form in wave A of ABC
-----------------------------------------------------------------------------
Up move ( Current)
3) Wave B can be any corrective structure. ( any of the above i mentioned)
Currently we are again seeing an impulse wave, which confirms that we are again going to see
a zigzag pattern (5-3-5) . [ shown on chart] . ( 1-2-3-4-5 / a-b-c/ 1-2-3-4-5) . More up move is
pending.
Wave B = 50%, 61.8%, 76.4% or 85.4% of wave A
------------------------ We are in sub wave A (1-2-3-4-5) of wave B .............................
Down move (Next)
4) During the next down move after completing wave B , market can go to complete wave C or trap people by forming a double 2 or double 3 patterns and then start the final down move and complete wave C ( it will be fast)
double 2 - zigzag + flat / triangle
double 3 - flat + zigzag + triangle ....these generally form in any order. Not saying market will form , just sharing theory.
Wave C is typically at least as large as wave A and often extends to 1.618 times wave A or beyond.
I think too much already...lets see how the markets trend...................
Tips
1) Always count Elliot waves in 1 H timeframe or more. Lower time frame will make you mad .
2) 3rd wave always gets confirmed with a break away gap ( 18th march 25) and followed by run away gaps ( following days) . The more the gaps the more strength the more bigger , this is how you identify an impulse wave
3rd wave in a diagonal wave doesn't have run away gaps , only break away gaps ( 19th Dec 24) and (13th Jan 25) . This is the reason why the 3rd wave is not the biggest in a diagonal wave and how it gets a "wedge" kind of shape.
Don't follow the levels on chart, its only for representation.
Happy Trading
Cheers!!!!!!!!!!!!!!!!
Just wanted to update on what's happening in Nifty50. Couldn't get time to put together a bit early( other works) . Anyway.....lets start. This is just my idea, views can and will differ.
As per our previous view, market bounced somewhere from ~21970 levels but its getting unfolded as an impulse wave...so the party is over for downside and sub wave A in ABC corrective wave is over. one wave is done ( corrective wave against the major trend which started from March 2020)
We are currently in wave B. Some people might be wondering how this sub wave B will unfold and some might even be thinking that downside is over as we are seeing an impulse wave and may hit ATH soon blah blah blah...
----------------------------------------------------------------------
First thing first always sharing knowledge.
Motive waves
Impulse or diagonal wave or Impulse with extensions
- Impulse is a 1-2-3-4-5 pattern where sub wave 3 is bigger.
- Diagonal is a 1-2-3-4-5 pattern where sub wave 1 ( wave 1 > wave 3 > wave 5 ) or
sub wave 5 ( wave 1 < wave 3 < wave 5 ) is bigger. Further classified into leading diagonal
and ending diagonal. Check online for more info or my previous post. saving my writing time.
- Extension is a 1-2-3-4-5 pattern similar to impulse but we will see one more (1-2-3-4-5)
inside wave 1 or wave 3 or wave 5.
Corrective waves
We have Zigzag (5-3-5) , Flat ( 3-3-5) , Triangle ( 3-3-3-3-3) , double 2 and double 3 as the corrective wave structures. Any where you see, these are the ones that unfold .
Lets see what market has done till now
Down move (Completed) (27th Sep 2024 - 4th March 2025)
Since its against the trend ( which started from covid time) market has to unfold in ABC pattern which is nothing but correction. This is over, we saw a "Contracting leading diagonal" . Leading diagonals always form in wave A of ABC
-----------------------------------------------------------------------------
Up move ( Current)
3) Wave B can be any corrective structure. ( any of the above i mentioned)
Currently we are again seeing an impulse wave, which confirms that we are again going to see
a zigzag pattern (5-3-5) . [ shown on chart] . ( 1-2-3-4-5 / a-b-c/ 1-2-3-4-5) . More up move is
pending.
Wave B = 50%, 61.8%, 76.4% or 85.4% of wave A
------------------------ We are in sub wave A (1-2-3-4-5) of wave B .............................
Down move (Next)
4) During the next down move after completing wave B , market can go to complete wave C or trap people by forming a double 2 or double 3 patterns and then start the final down move and complete wave C ( it will be fast)
double 2 - zigzag + flat / triangle
double 3 - flat + zigzag + triangle ....these generally form in any order. Not saying market will form , just sharing theory.
Wave C is typically at least as large as wave A and often extends to 1.618 times wave A or beyond.
I think too much already...lets see how the markets trend...................
Tips
1) Always count Elliot waves in 1 H timeframe or more. Lower time frame will make you mad .
2) 3rd wave always gets confirmed with a break away gap ( 18th march 25) and followed by run away gaps ( following days) . The more the gaps the more strength the more bigger , this is how you identify an impulse wave
3rd wave in a diagonal wave doesn't have run away gaps , only break away gaps ( 19th Dec 24) and (13th Jan 25) . This is the reason why the 3rd wave is not the biggest in a diagonal wave and how it gets a "wedge" kind of shape.
Don't follow the levels on chart, its only for representation.
Happy Trading
Cheers!!!!!!!!!!!!!!!!
Pubblicazioni correlate
Declinazione di responsabilità
Le informazioni ed i contenuti pubblicati non costituiscono in alcun modo una sollecitazione ad investire o ad operare nei mercati finanziari. Non sono inoltre fornite o supportate da TradingView. Maggiori dettagli nelle Condizioni d'uso.
Pubblicazioni correlate
Declinazione di responsabilità
Le informazioni ed i contenuti pubblicati non costituiscono in alcun modo una sollecitazione ad investire o ad operare nei mercati finanziari. Non sono inoltre fornite o supportate da TradingView. Maggiori dettagli nelle Condizioni d'uso.