🔎 Nifty Market Structure Analysis
4H Chart
Trend Bias: Bearish → price is still making lower highs and lower lows.
Supply Zones:
24,880 – 24,940 (fresh supply, last bearish OB).
25,220 – 25,280 (major supply; high confluence).
Demand Zone:
24,520 – 24,560 (strong demand; multiple rejections).
Liquidity: Sell-side liquidity resting below 24,520, which may attract a sweep.
1H Chart
Price is consolidating between 24,520 (demand) and 24,880 (supply).
Recent bounce shows buyers defending 24,550–24,580, but follow-through is weak.
Multiple FVGs (Fair Value Gaps) above; could act as magnets if price pushes up.
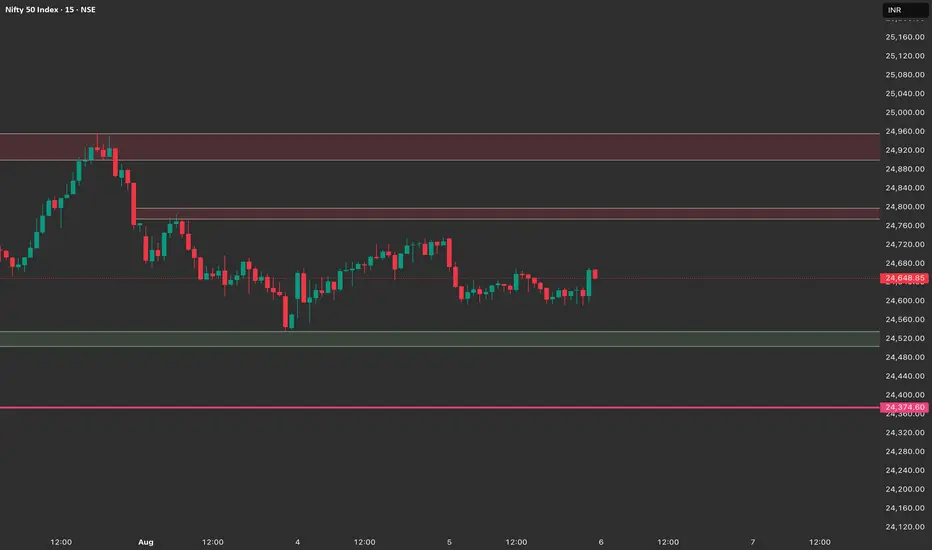
15M Chart
Microstructure: Attempted bounce from 24,560, but supply pressure visible near 24,720 – 24,760.
Short-term bullish recovery possible, but supply overhead is heavy.
Any strong rejection near 24,750 would confirm continuation lower.
📌 Trade Plan for Tomorrow (6th Aug)
Scenario 1 – Bearish Continuation (High Probability)
Entry: Short near 24,720 – 24,760 supply zone.
Stop Loss: Above 24,800 (recent swing high).
Targets:
T1: 24,560
T2: 24,400 – 24,420 (major liquidity sweep zone).
Rationale: Aligns with overall bearish 4H trend and rejection from supply.
Scenario 2 – Bullish Intraday Bounce (Only on Strong Rejection Wick)
Entry: Long near 24,520 – 24,560 demand zone if bullish engulfing / rejection wick forms.
Stop Loss: Below 24,480.
Targets:
T1: 24,720
T2: 24,880
Note: Counter-trend, keep position sizing small.
❌ No-Trade Zone
Avoid trading between 24,600 – 24,700 (current chop area).
Wait for price to either test supply (24,720–24,760) or demand (24,520–24,560) for clean entries.
✅ Summary:
Bias remains bearish.
Best trade for tomorrow: Look for short setups near 24,720–24,760 supply with targets towards 24,400–24,420. Go long only if we see a strong demand reaction near 24,520–24,560.
4H Chart
Trend Bias: Bearish → price is still making lower highs and lower lows.
Supply Zones:
24,880 – 24,940 (fresh supply, last bearish OB).
25,220 – 25,280 (major supply; high confluence).
Demand Zone:
24,520 – 24,560 (strong demand; multiple rejections).
Liquidity: Sell-side liquidity resting below 24,520, which may attract a sweep.
1H Chart
Price is consolidating between 24,520 (demand) and 24,880 (supply).
Recent bounce shows buyers defending 24,550–24,580, but follow-through is weak.
Multiple FVGs (Fair Value Gaps) above; could act as magnets if price pushes up.
15M Chart
Microstructure: Attempted bounce from 24,560, but supply pressure visible near 24,720 – 24,760.
Short-term bullish recovery possible, but supply overhead is heavy.
Any strong rejection near 24,750 would confirm continuation lower.
📌 Trade Plan for Tomorrow (6th Aug)
Scenario 1 – Bearish Continuation (High Probability)
Entry: Short near 24,720 – 24,760 supply zone.
Stop Loss: Above 24,800 (recent swing high).
Targets:
T1: 24,560
T2: 24,400 – 24,420 (major liquidity sweep zone).
Rationale: Aligns with overall bearish 4H trend and rejection from supply.
Scenario 2 – Bullish Intraday Bounce (Only on Strong Rejection Wick)
Entry: Long near 24,520 – 24,560 demand zone if bullish engulfing / rejection wick forms.
Stop Loss: Below 24,480.
Targets:
T1: 24,720
T2: 24,880
Note: Counter-trend, keep position sizing small.
❌ No-Trade Zone
Avoid trading between 24,600 – 24,700 (current chop area).
Wait for price to either test supply (24,720–24,760) or demand (24,520–24,560) for clean entries.
✅ Summary:
Bias remains bearish.
Best trade for tomorrow: Look for short setups near 24,720–24,760 supply with targets towards 24,400–24,420. Go long only if we see a strong demand reaction near 24,520–24,560.
Declinazione di responsabilità
Le informazioni ed i contenuti pubblicati non costituiscono in alcun modo una sollecitazione ad investire o ad operare nei mercati finanziari. Non sono inoltre fornite o supportate da TradingView. Maggiori dettagli nelle Condizioni d'uso.
Declinazione di responsabilità
Le informazioni ed i contenuti pubblicati non costituiscono in alcun modo una sollecitazione ad investire o ad operare nei mercati finanziari. Non sono inoltre fornite o supportate da TradingView. Maggiori dettagli nelle Condizioni d'uso.