NIFTY TRADING PLAN – 12-Sep-2025
📈 Current Spot: 25,008
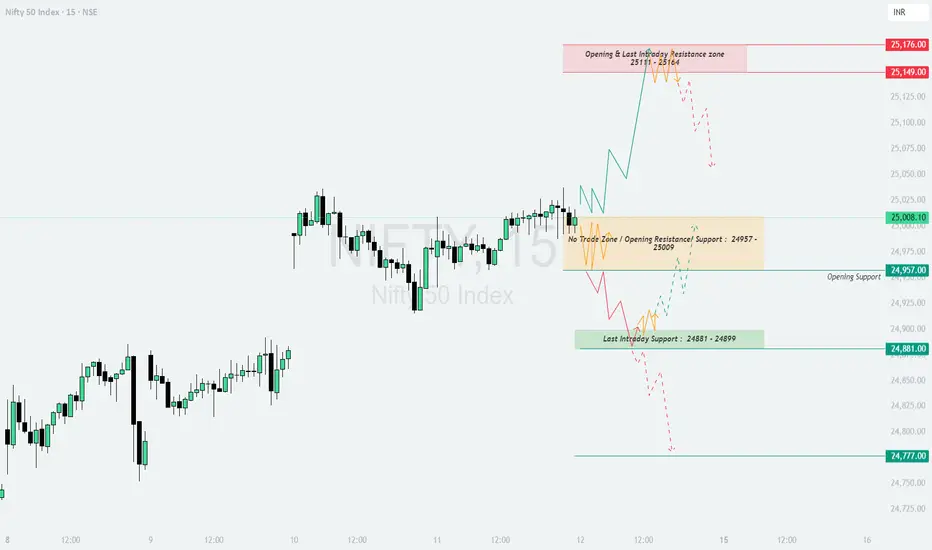
🔑 Key Levels to Watch:
Opening & Last Intraday Resistance Zone: 25,111 – 25,124
Intermediate Resistance: 25,176
No Trade Zone / Neutral Area: 24,957 – 25,009
Opening Support: 24,957
Last Intraday Support: 24,881 – 24,899
Major Support: 24,777
🔹 Scenario 1: Gap-Up Opening (100+ Points above 25,108)
📌 Educational Insight: Large gap-ups near resistance often trap late buyers. Smart traders wait for confirmation of strength above resistance before entering long trades.
🚨 Risk Tip: In case of a failed breakout, switch to defensive mode and avoid averaging calls. Focus on reversals toward support zones for better entries.
🔹 Scenario 2: Flat Opening (Between 24,957 – 25,009)
📌 Educational Insight: Sideways openings are best handled with patience. Overtrading in the “No Trade Zone” often results in whipsaws.
🚨 Risk Tip: Use smaller position sizes and strict stop-loss when trading flat openings. Better to wait for clear breakouts than to force trades.
🔹 Scenario 3: Gap-Down Opening (100+ Points below 24,908)
📌 Educational Insight: Gap-downs into strong support zones often create oversold bounces. Always look for confirmation before entering short trades.
🚨 Risk Tip: Instead of naked put buying after gap-downs, consider spreads (Bear Put Spread) to balance premium decay.
📝 Summary & Conclusion
Bullish above: 25,111 → Targets: 25,124 / 25,176
Neutral Zone: 24,957 – 25,009 (avoid overtrading)
Bearish below: 24,881 → Next support: 24,777
📌 Focus on the Resistance Zone 25,111 – 25,124 for bullish breakouts and Support Zone 24,881 – 24,899 for bearish breakdowns.
💡 Options Tip: Always align with the trend. Avoid OTM strikes in choppy zones; prefer ATM/ITM for directional moves.
⚠️ Disclaimer: I am not a SEBI-registered analyst. This plan is for educational purposes only. Please do your own analysis or consult a financial advisor before making any trading decisions.
📈 Current Spot: 25,008
🔑 Key Levels to Watch:
Opening & Last Intraday Resistance Zone: 25,111 – 25,124
Intermediate Resistance: 25,176
No Trade Zone / Neutral Area: 24,957 – 25,009
Opening Support: 24,957
Last Intraday Support: 24,881 – 24,899
Major Support: 24,777
🔹 Scenario 1: Gap-Up Opening (100+ Points above 25,108)
- [] If Nifty opens above 25,108, it will directly test the Resistance Zone 25,111 – 25,124.
[] Sustaining above this zone with strong momentum can extend the rally toward 25,176, which will be a crucial profit-booking zone. - Failure to hold above 25,111 – 25,124 may trigger a pullback back into the No Trade Zone (25,009 – 24,957).
📌 Educational Insight: Large gap-ups near resistance often trap late buyers. Smart traders wait for confirmation of strength above resistance before entering long trades.
🚨 Risk Tip: In case of a failed breakout, switch to defensive mode and avoid averaging calls. Focus on reversals toward support zones for better entries.
🔹 Scenario 2: Flat Opening (Between 24,957 – 25,009)
- [] If Nifty opens flat in the No Trade Zone, wait for a breakout or breakdown to confirm direction.
[] A breakout above 25,009 opens the door to test 25,111 – 25,124 resistance, and eventually 25,176 if strength persists. - A breakdown below 24,957 will shift focus to 24,881 – 24,899, where buyers may attempt to defend.
📌 Educational Insight: Sideways openings are best handled with patience. Overtrading in the “No Trade Zone” often results in whipsaws.
🚨 Risk Tip: Use smaller position sizes and strict stop-loss when trading flat openings. Better to wait for clear breakouts than to force trades.
🔹 Scenario 3: Gap-Down Opening (100+ Points below 24,908)
- [] If Nifty opens below 24,908, it will put pressure on the Last Intraday Support Zone (24,881 – 24,899).
[] Breaking below this zone decisively can drag prices toward the next strong support at 24,777. - If the index defends 24,881 – 24,899 and rebounds, a short-covering move back toward 24,957 – 25,009 is possible.
📌 Educational Insight: Gap-downs into strong support zones often create oversold bounces. Always look for confirmation before entering short trades.
🚨 Risk Tip: Instead of naked put buying after gap-downs, consider spreads (Bear Put Spread) to balance premium decay.
📝 Summary & Conclusion
Bullish above: 25,111 → Targets: 25,124 / 25,176
Neutral Zone: 24,957 – 25,009 (avoid overtrading)
Bearish below: 24,881 → Next support: 24,777
📌 Focus on the Resistance Zone 25,111 – 25,124 for bullish breakouts and Support Zone 24,881 – 24,899 for bearish breakdowns.
💡 Options Tip: Always align with the trend. Avoid OTM strikes in choppy zones; prefer ATM/ITM for directional moves.
⚠️ Disclaimer: I am not a SEBI-registered analyst. This plan is for educational purposes only. Please do your own analysis or consult a financial advisor before making any trading decisions.
Declinazione di responsabilità
Le informazioni e le pubblicazioni non sono intese come, e non costituiscono, consulenza o raccomandazioni finanziarie, di investimento, di trading o di altro tipo fornite o approvate da TradingView. Per ulteriori informazioni, consultare i Termini di utilizzo.
Declinazione di responsabilità
Le informazioni e le pubblicazioni non sono intese come, e non costituiscono, consulenza o raccomandazioni finanziarie, di investimento, di trading o di altro tipo fornite o approvate da TradingView. Per ulteriori informazioni, consultare i Termini di utilizzo.