Nifty has continued to be dominated by bears, extending its losing streak for an eighth consecutive session. The index is holding barely above its most critical near-term support.
Detailed Market Structure Breakdown
4-Hour Chart (Macro Trend)
Structure: The Nifty is firmly in a deep corrective phase, trading within a steep descending channel. The index is positioned right on the crucial 24,600 - 24,700 macro demand zone, which must hold to prevent a major breakdown. The failure to find a strong bounce on Monday and Tuesday confirms the strength of the bearish momentum.
Key Levels:
Major Supply (Resistance): 24,800 - 24,900. This area, which includes a prior FVG (Fair Value Gap), is the immediate overhead resistance.
Major Demand (Support): 24,600. This is the key "line in the sand." A decisive break below 24,600 would signal a deeper correction toward the next significant support at 24,400.
Outlook: The market is at an inflection point ahead of the RBI policy outcome (scheduled for Wednesday, October 1). The extreme selling pressure may lead to volatility, but the overall trend remains "sell on rise."
1-Hour Chart (Intermediate View)
Structure: The 1H chart is strongly bearish, with price action confined to a descending channel. The market is consolidating at the very bottom of the channel and the horizontal support, indicating a strong defense by bulls but limited recovery power.
Key Levels:
Immediate Resistance: The upper trendline of the descending channel, near 24,750.
Immediate Support: 24,600.
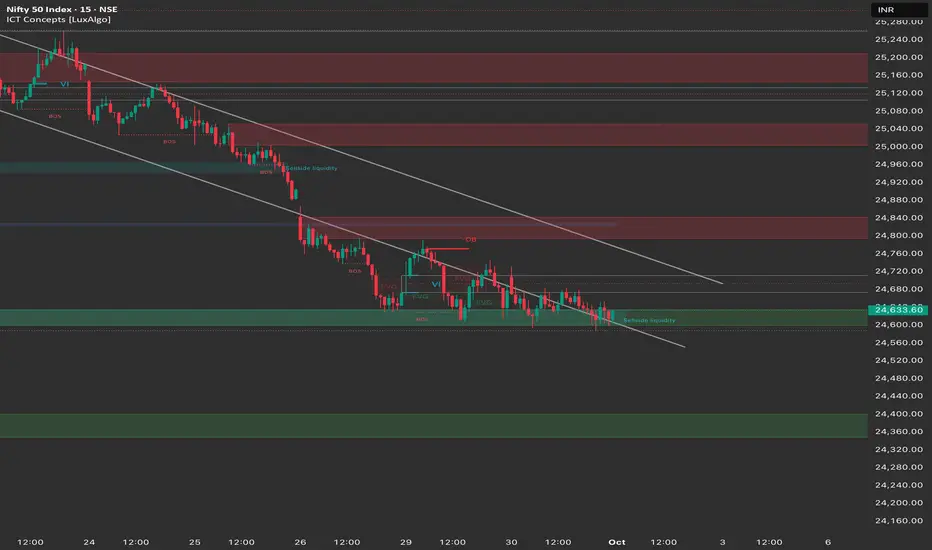
15-Minute Chart (Intraday View)
Structure: The 15M chart shows clear consolidation in a tight range, characterized by a series of BOS (Break of Structure) to the downside, followed by weak, shallow pullbacks. The index is testing the lower boundaries of the range.
Key Levels:
Intraday Supply: 24,700 - 24,750. This area is the immediate high of the recent consolidation.
Intraday Demand: 24,600. The crucial support for the open.
Outlook: The primary direction is still bearish. The strategy will be to play the move out of the tight range.
Trade Plan (Wednesday, 1st October)
Market Outlook: Caution is advised due to the RBI Monetary Policy Committee (MPC) outcome scheduled for today. Expect high volatility, especially around the announcement. The plan focuses on the break of the immediate range.
Bearish Scenario (Primary Plan)
Justification: The continuation of the strong bearish trend and a decisive break of the macro support.
Entry: Short entry on a decisive break and 15-minute candle close below 24,600.
Stop Loss (SL): Place a stop loss above 24,700.
Targets:
T1: 24,500 (Psychological support).
T2: 24,400 (Next major demand zone / 200-day EMA support).
Bullish Scenario (Counter-Trend/Reversal Plan)
Justification: A short-covering rally, possibly triggered by a "dovish pause" in the RBI policy or positive global cues.
Trigger: A sustained move and close above the immediate resistance at 24,750.
Entry: Long entry on a confirmed 15-minute close above 24,750.
Stop Loss (SL): Below 24,650.
Targets:
T1: 24,850 (Upper channel resistance).
T2: 25,000 (Psychological resistance).
Key Levels for Observation:
Immediate Decision Point: The 24,600 - 24,750 zone.
Bearish Confirmation: A break and sustained move below 24,600.
Bullish Confirmation: A recapture of the 24,750 level.
Crucial Event: RBI MPC outcome. Volatility is expected to peak around the announcement.
Line in the Sand: 24,600. Below this, the sellers are in full control.
Detailed Market Structure Breakdown
4-Hour Chart (Macro Trend)
Structure: The Nifty is firmly in a deep corrective phase, trading within a steep descending channel. The index is positioned right on the crucial 24,600 - 24,700 macro demand zone, which must hold to prevent a major breakdown. The failure to find a strong bounce on Monday and Tuesday confirms the strength of the bearish momentum.
Key Levels:
Major Supply (Resistance): 24,800 - 24,900. This area, which includes a prior FVG (Fair Value Gap), is the immediate overhead resistance.
Major Demand (Support): 24,600. This is the key "line in the sand." A decisive break below 24,600 would signal a deeper correction toward the next significant support at 24,400.
Outlook: The market is at an inflection point ahead of the RBI policy outcome (scheduled for Wednesday, October 1). The extreme selling pressure may lead to volatility, but the overall trend remains "sell on rise."
1-Hour Chart (Intermediate View)
Structure: The 1H chart is strongly bearish, with price action confined to a descending channel. The market is consolidating at the very bottom of the channel and the horizontal support, indicating a strong defense by bulls but limited recovery power.
Key Levels:
Immediate Resistance: The upper trendline of the descending channel, near 24,750.
Immediate Support: 24,600.
15-Minute Chart (Intraday View)
Structure: The 15M chart shows clear consolidation in a tight range, characterized by a series of BOS (Break of Structure) to the downside, followed by weak, shallow pullbacks. The index is testing the lower boundaries of the range.
Key Levels:
Intraday Supply: 24,700 - 24,750. This area is the immediate high of the recent consolidation.
Intraday Demand: 24,600. The crucial support for the open.
Outlook: The primary direction is still bearish. The strategy will be to play the move out of the tight range.
Trade Plan (Wednesday, 1st October)
Market Outlook: Caution is advised due to the RBI Monetary Policy Committee (MPC) outcome scheduled for today. Expect high volatility, especially around the announcement. The plan focuses on the break of the immediate range.
Bearish Scenario (Primary Plan)
Justification: The continuation of the strong bearish trend and a decisive break of the macro support.
Entry: Short entry on a decisive break and 15-minute candle close below 24,600.
Stop Loss (SL): Place a stop loss above 24,700.
Targets:
T1: 24,500 (Psychological support).
T2: 24,400 (Next major demand zone / 200-day EMA support).
Bullish Scenario (Counter-Trend/Reversal Plan)
Justification: A short-covering rally, possibly triggered by a "dovish pause" in the RBI policy or positive global cues.
Trigger: A sustained move and close above the immediate resistance at 24,750.
Entry: Long entry on a confirmed 15-minute close above 24,750.
Stop Loss (SL): Below 24,650.
Targets:
T1: 24,850 (Upper channel resistance).
T2: 25,000 (Psychological resistance).
Key Levels for Observation:
Immediate Decision Point: The 24,600 - 24,750 zone.
Bearish Confirmation: A break and sustained move below 24,600.
Bullish Confirmation: A recapture of the 24,750 level.
Crucial Event: RBI MPC outcome. Volatility is expected to peak around the announcement.
Line in the Sand: 24,600. Below this, the sellers are in full control.
Declinazione di responsabilità
Le informazioni e le pubblicazioni non sono intese come, e non costituiscono, consulenza o raccomandazioni finanziarie, di investimento, di trading o di altro tipo fornite o approvate da TradingView. Per ulteriori informazioni, consultare i Termini di utilizzo.
Declinazione di responsabilità
Le informazioni e le pubblicazioni non sono intese come, e non costituiscono, consulenza o raccomandazioni finanziarie, di investimento, di trading o di altro tipo fornite o approvate da TradingView. Per ulteriori informazioni, consultare i Termini di utilizzo.