The market's performance on Friday, September 26, the Nifty has continued its sharp decline, breaking multiple support levels. The market is now in a strong bearish trend, with a clear downward channel across all timeframes.
Detailed Market Structure Breakdown
4-Hour Chart (Macro Trend)
Structure: The Nifty is in a deep corrective phase, having broken the critical 25,050 - 25,100 zone and continued its fall. The price closed right at the strong macro demand zone of 24,650 - 24,700, which is a prior accumulation area. This area is the key "line in the sand" for the medium-term bullish structure that started in early September.
Key Levels:
Major Supply (Resistance): 24,800 - 24,850. This area is now a strong overhead resistance, aligning with the broken lower channel line from the previous week.
Major Demand (Support): 24,600 - 24,650. This is the immediate and most critical support zone. A sustained breakdown below 24,600 would suggest the correction is far from over, with the next target at 24,400.
Outlook: The trend is strongly bearish, but the index is sitting on a major support level. A bounce is highly probable from this zone, but the overall bias remains "sell on rise."
1-Hour Chart (Intermediate View)
Structure: The 1H chart is strongly bearish, trading in a well-defined descending channel. The market is making lower lows and lower highs, and the latest move penetrated the strong 24,650 support zone before a slight bounce.
Key Levels:
Immediate Resistance: The upper trendline of the descending channel, currently near 24,780.
Immediate Support: 24,600. This is the level that bulls must defend at the open.
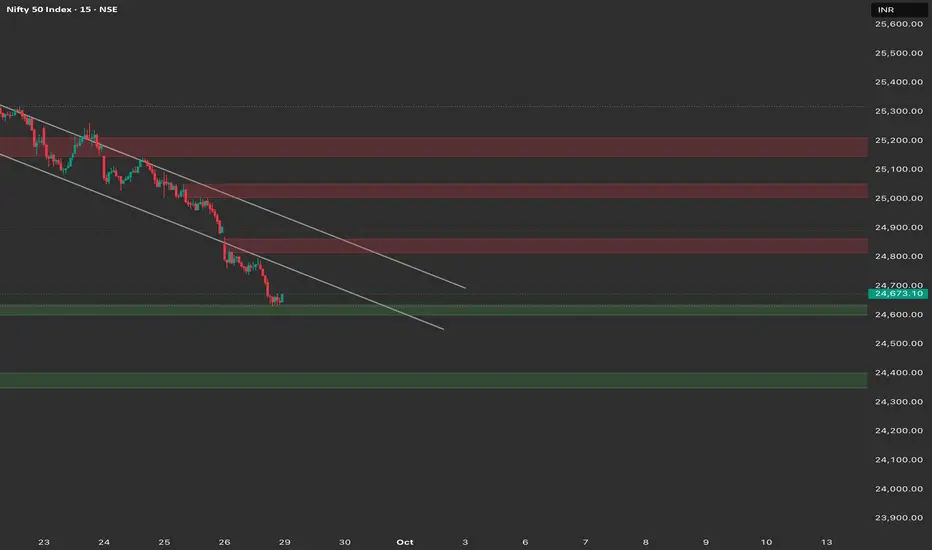
15-Minute Chart (Intraday View)
Structure: The 15M chart confirms the steep bearish momentum. The index is trading at the bottom of its descending channel. Any opening below 24,650 will invite further selling.
Key Levels:
Intraday Supply: 24,750 - 24,800. This is the high of the recent small consolidation and the immediate resistance.
Intraday Demand: 24,600. The crucial level to watch for Monday.
Outlook: The primary strategy is to sell into strength or on a breakdown, as the overall trend is down.
Trade Plan (Monday, 29th September)
Market Outlook: The Nifty is bearish, but located at a major support zone. The strategy is centered on whether 24,600 holds.
Bearish Scenario (Primary Plan)
Justification: The breakdown below the macro support at 24,600 would confirm the continuation of the strong bearish trend toward the next accumulation zone.
Entry: Short entry on a decisive break and 15-minute candle close below 24,600.
Stop Loss (SL): Place a stop loss above 24,700.
Targets:
T1: 24,500 (Minor psychological support).
T2: 24,400 (Next major support zone).
Bullish Scenario (Counter-Trend/Reversal Plan)
Justification: This is a high-risk, counter-trend plan. It relies on the strong demand zone at 24,600 holding firm.
Trigger: A reversal from the 24,600 - 24,650 zone (e.g., a hammer or bullish engulfing candle) or a sustained move and close above 24,800.
Entry: Long entry on a confirmed bounce from 24,600 - 24,650 with a bullish pattern, or on a break above 24,800.
Stop Loss (SL): Below 24,580 (for a bounce trade) or 24,700 (for a breakout trade).
Targets:
T1: 24,850 (Upper channel resistance).
T2: 25,000 (Psychological resistance).
Key Levels for Observation:
Immediate Decision Point: The 24,600 - 24,700 zone.
Bearish Confirmation: A break and sustained move below 24,600.
Bullish Confirmation: A recapture of the 24,800 level.
Line in the Sand: 24,600. The overall market structure will weaken significantly below this level.
Detailed Market Structure Breakdown
4-Hour Chart (Macro Trend)
Structure: The Nifty is in a deep corrective phase, having broken the critical 25,050 - 25,100 zone and continued its fall. The price closed right at the strong macro demand zone of 24,650 - 24,700, which is a prior accumulation area. This area is the key "line in the sand" for the medium-term bullish structure that started in early September.
Key Levels:
Major Supply (Resistance): 24,800 - 24,850. This area is now a strong overhead resistance, aligning with the broken lower channel line from the previous week.
Major Demand (Support): 24,600 - 24,650. This is the immediate and most critical support zone. A sustained breakdown below 24,600 would suggest the correction is far from over, with the next target at 24,400.
Outlook: The trend is strongly bearish, but the index is sitting on a major support level. A bounce is highly probable from this zone, but the overall bias remains "sell on rise."
1-Hour Chart (Intermediate View)
Structure: The 1H chart is strongly bearish, trading in a well-defined descending channel. The market is making lower lows and lower highs, and the latest move penetrated the strong 24,650 support zone before a slight bounce.
Key Levels:
Immediate Resistance: The upper trendline of the descending channel, currently near 24,780.
Immediate Support: 24,600. This is the level that bulls must defend at the open.
15-Minute Chart (Intraday View)
Structure: The 15M chart confirms the steep bearish momentum. The index is trading at the bottom of its descending channel. Any opening below 24,650 will invite further selling.
Key Levels:
Intraday Supply: 24,750 - 24,800. This is the high of the recent small consolidation and the immediate resistance.
Intraday Demand: 24,600. The crucial level to watch for Monday.
Outlook: The primary strategy is to sell into strength or on a breakdown, as the overall trend is down.
Trade Plan (Monday, 29th September)
Market Outlook: The Nifty is bearish, but located at a major support zone. The strategy is centered on whether 24,600 holds.
Bearish Scenario (Primary Plan)
Justification: The breakdown below the macro support at 24,600 would confirm the continuation of the strong bearish trend toward the next accumulation zone.
Entry: Short entry on a decisive break and 15-minute candle close below 24,600.
Stop Loss (SL): Place a stop loss above 24,700.
Targets:
T1: 24,500 (Minor psychological support).
T2: 24,400 (Next major support zone).
Bullish Scenario (Counter-Trend/Reversal Plan)
Justification: This is a high-risk, counter-trend plan. It relies on the strong demand zone at 24,600 holding firm.
Trigger: A reversal from the 24,600 - 24,650 zone (e.g., a hammer or bullish engulfing candle) or a sustained move and close above 24,800.
Entry: Long entry on a confirmed bounce from 24,600 - 24,650 with a bullish pattern, or on a break above 24,800.
Stop Loss (SL): Below 24,580 (for a bounce trade) or 24,700 (for a breakout trade).
Targets:
T1: 24,850 (Upper channel resistance).
T2: 25,000 (Psychological resistance).
Key Levels for Observation:
Immediate Decision Point: The 24,600 - 24,700 zone.
Bearish Confirmation: A break and sustained move below 24,600.
Bullish Confirmation: A recapture of the 24,800 level.
Line in the Sand: 24,600. The overall market structure will weaken significantly below this level.
Declinazione di responsabilità
Le informazioni ed i contenuti pubblicati non costituiscono in alcun modo una sollecitazione ad investire o ad operare nei mercati finanziari. Non sono inoltre fornite o supportate da TradingView. Maggiori dettagli nelle Condizioni d'uso.
Declinazione di responsabilità
Le informazioni ed i contenuti pubblicati non costituiscono in alcun modo una sollecitazione ad investire o ad operare nei mercati finanziari. Non sono inoltre fornite o supportate da TradingView. Maggiori dettagli nelle Condizioni d'uso.