\📊 NIFTY TRADING PLAN – 1-Jul-2025\
📍 \Previous Close:\ 25,507
📏 \Gap Opening Consideration:\ ±100 points
🧭 \Key Zones to Monitor:\
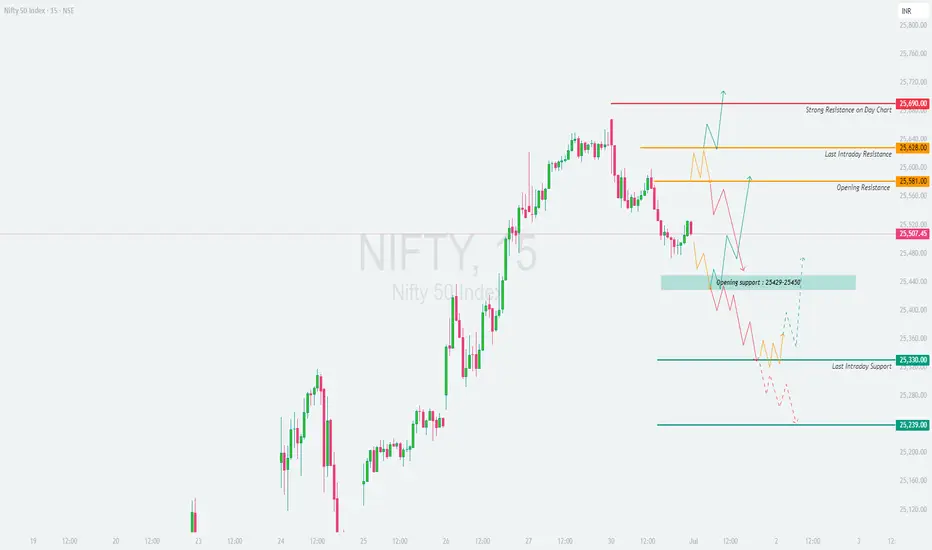
🔴 Strong Resistance on Day Chart: \25,690\
🟧 Last Intraday Resistance: \25,628 – 25,640\
🟨 Opening Resistance: \25,581\
🟦 Opening Support: \25,429 – 25,450\
🟩 Last Intraday Support: \25,330\
🟫 Final Support: \25,239\
---
\
\[\*]\🚀 GAP-UP OPENING (Above 25,640):\
A gap-up above \25,640\ pushes Nifty into the \Strong Resistance zone\ visible on the daily chart. This area may trigger profit booking unless broken with strong volume and momentum.
✅ \Plan of Action:\
• Wait for a 15-min candle close above 25,690 for confirmation of breakout
• If price stalls or forms reversal patterns, initiate short trade setups
• Only aggressive buyers may consider long trades above 25,690 if follow-up candles are strong
🎯 \Trade Setup:\
– \Buy above:\ 25,690, SL: 25,628, Target: Trailing towards 25,750+
– \Sell near resistance:\ 25,675–25,690 zone if reversal confirmed, SL: 25,705, Target: 25,581
📘 \Tip:\ Avoid buying directly into resistance. Wait for a breakout + retest for cleaner entries.
\[\*]\⚖️ FLAT OPENING (Near 25,500 – 25,540):\
Flat openings near the \Opening Resistance (25,581)\ can create indecisive sideways moves in early sessions.
✅ \Plan of Action:\
• If price breaks above 25,581 with strength, look for long trades
• If price faces rejection near 25,581 or 25,628, wait for breakdown below 25,507 to confirm weakness
• Below 25,507, next support lies at the 25,429–25,450 zone
🎯 \Trade Setup:\
– \Buy above breakout of 25,581, SL: 25,500, Target: 25,628–25,690
– \Sell below 25,507, SL: 25,581, Target: 25,450 or lower
📘 \Tip:\ Flat opens are best traded on confirmation candles, not assumptions. Avoid overtrading.
\[\*]\📉 GAP-DOWN OPENING (Below 25,400):\
A gap-down below 25,400 opens the day near the \Opening Support zone of 25,429–25,450\. This area is critical — a bounce or breakdown will define the day.
✅ \Plan of Action:\
• If price shows bullish reversal signs near 25,429, consider a pullback trade
• Breakdown of 25,429 with volume may extend downside toward 25,330 and even 25,239
• Avoid chasing long trades unless price stabilizes above 25,450
🎯 \Trade Setup:\
– \Buy near support:\ 25,429 with SL below 25,390, Target: 25,507
– \Sell on breakdown below 25,429, SL: 25,450, Target: 25,330 – 25,239
📘 \Tip:\ Gap-down opens attract trap setups. Let the market settle before committing.
---
\🧭 KEY LEVELS – QUICK REFERENCE:\
🔺 \Strong Resistance:\ 25,690
🟧 \Last Resistance:\ 25,628 – 25,640
🟨 \Opening Resistance:\ 25,581
🟦 \Opening Support:\ 25,429 – 25,450
🟩 \Intraday Support:\ 25,330
🟥 \Final Support:\ 25,239
---
\💡 OPTIONS TRADING – RISK MANAGEMENT TIPS:\
✅ Stick to \defined range breakouts\ before entering directional trades
✅ Don’t overleverage into gap-ups/downs; let premiums cool
✅ \Avoid selling naked options\ without clear structure
✅ Protect capital with \hedged strategies\ like debit spreads
✅ \Exit when your reason is invalidated\, not when SL hits randomly
🛡️ \Always use stop-losses\, especially in high-IV environments.
---
\📌 SUMMARY:\
• 📈 \Bullish above:\ 25,581 → 25,640 → 25,690
• 📉 \Bearish below:\ 25,507 → 25,429 → 25,330
• 🚫 \No trade zone:\ 25,507–25,581 (if inside, wait for clarity)
🎯 \Focus Zones:\
– Long breakout above 25,581
– Short breakdown below 25,429
– Reversal plays at 25,429 or 25,239 if structure supports
---
\⚠️ DISCLAIMER:\
I am not a SEBI-registered analyst. This content is shared only for educational purposes. Please do your own analysis or consult a professional financial advisor before taking trades. Risk management is essential—never trade without a stop-loss and always protect your capital.
Declinazione di responsabilità
Le informazioni e le pubblicazioni non sono intese come, e non costituiscono, consulenza o raccomandazioni finanziarie, di investimento, di trading o di altro tipo fornite o approvate da TradingView. Per ulteriori informazioni, consultare i Termini di utilizzo.
Declinazione di responsabilità
Le informazioni e le pubblicazioni non sono intese come, e non costituiscono, consulenza o raccomandazioni finanziarie, di investimento, di trading o di altro tipo fornite o approvate da TradingView. Per ulteriori informazioni, consultare i Termini di utilizzo.