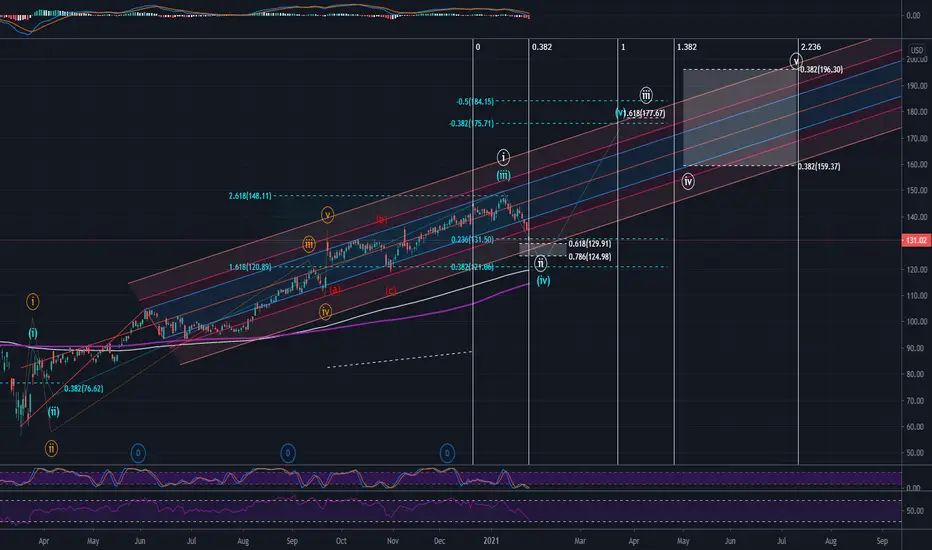
I have 2 possible counts for Nike.
The first count in blue indicates is an extended W3 to the 2.618 level with a current W4 in progress. We are right around the 23.6 retracement for W4. A shallow W4 retracement makes sense due to our extended W3, and the RSI and Stoch RSI on the daily chart are both oversold. This setup looks primed for a reversal to finish a W5 which, if extended to 38.2% above the W3 high, would result in a final projection of around $175 by March 23.
The second cound in white models the beginning of a new cycle (follwing on from the completion of the first cycle in orange). This count indicates a wave 2 retracement which has nearly reached the 61.8% pull back, and is ready for a reversal for wave 3 which would take NKE to $177 by march 23.
Both counts indicate a reversal, and the RSI/Stoch RSI support this thesis. The pitchfork created by connecting the March lows to the June highs and the June lows gives a channel with multiple reactions off the median, the 1 and the 1.618 lines. The current price is right at the 1.618 line where it has bouin ed previously on Sept 22/23 and Oct 30. The price is also at the 4Hr 200 EMA and 200 MA support currently.
This gives us 2 wave counts (blue W4 and white W2), the RSI/Stoch RSI indicator, the Pitchfork support and the 4Hr 200 MA/EMA support all indicating a trend reversal.
This projection is invalidated if the price falls below $120. The price target in the mid term is $175 by end of march.
The first count in blue indicates is an extended W3 to the 2.618 level with a current W4 in progress. We are right around the 23.6 retracement for W4. A shallow W4 retracement makes sense due to our extended W3, and the RSI and Stoch RSI on the daily chart are both oversold. This setup looks primed for a reversal to finish a W5 which, if extended to 38.2% above the W3 high, would result in a final projection of around $175 by March 23.
The second cound in white models the beginning of a new cycle (follwing on from the completion of the first cycle in orange). This count indicates a wave 2 retracement which has nearly reached the 61.8% pull back, and is ready for a reversal for wave 3 which would take
Both counts indicate a reversal, and the RSI/Stoch RSI support this thesis. The pitchfork created by connecting the March lows to the June highs and the June lows gives a channel with multiple reactions off the median, the 1 and the 1.618 lines. The current price is right at the 1.618 line where it has bouin ed previously on Sept 22/23 and Oct 30. The price is also at the 4Hr 200 EMA and 200 MA support currently.
This gives us 2 wave counts (blue W4 and white W2), the RSI/Stoch RSI indicator, the Pitchfork support and the 4Hr 200 MA/EMA support all indicating a trend reversal.
This projection is invalidated if the price falls below $120. The price target in the mid term is $175 by end of march.
Declinazione di responsabilità
Le informazioni ed i contenuti pubblicati non costituiscono in alcun modo una sollecitazione ad investire o ad operare nei mercati finanziari. Non sono inoltre fornite o supportate da TradingView. Maggiori dettagli nelle Condizioni d'uso.
Declinazione di responsabilità
Le informazioni ed i contenuti pubblicati non costituiscono in alcun modo una sollecitazione ad investire o ad operare nei mercati finanziari. Non sono inoltre fornite o supportate da TradingView. Maggiori dettagli nelle Condizioni d'uso.
