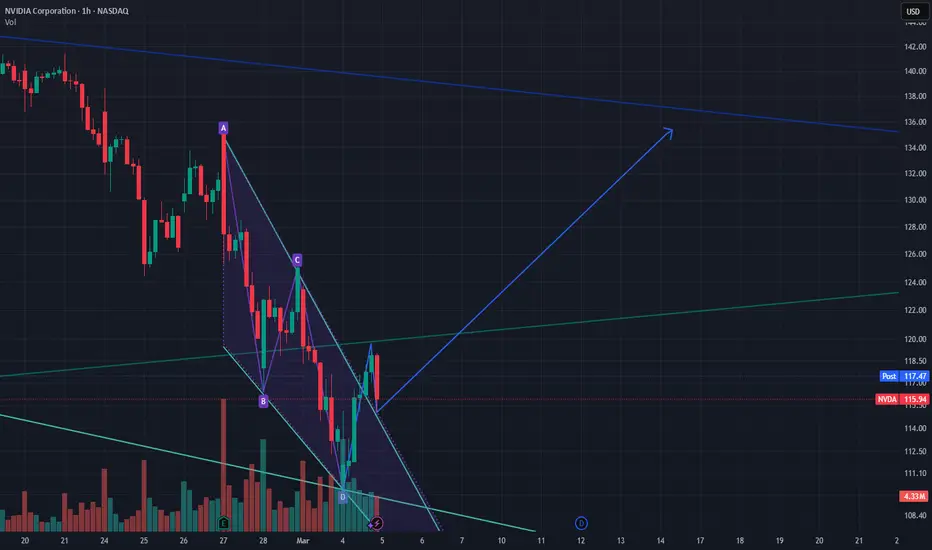
Another falling wedge pattern has formed on NVDA's hourly chart, with price action contained between two converging downward trendlines. The stock shows a potential bullish reversal setup after testing major support at 109. Volume has been declining during the pattern formation, which is why a falling wedge. Pull back to retest upper trendline.
SL at 108 1st target 131
SL at 108 1st target 131
Pubblicazioni correlate
Declinazione di responsabilità
Le informazioni ed i contenuti pubblicati non costituiscono in alcun modo una sollecitazione ad investire o ad operare nei mercati finanziari. Non sono inoltre fornite o supportate da TradingView. Maggiori dettagli nelle Condizioni d'uso.
Pubblicazioni correlate
Declinazione di responsabilità
Le informazioni ed i contenuti pubblicati non costituiscono in alcun modo una sollecitazione ad investire o ad operare nei mercati finanziari. Non sono inoltre fornite o supportate da TradingView. Maggiori dettagli nelle Condizioni d'uso.