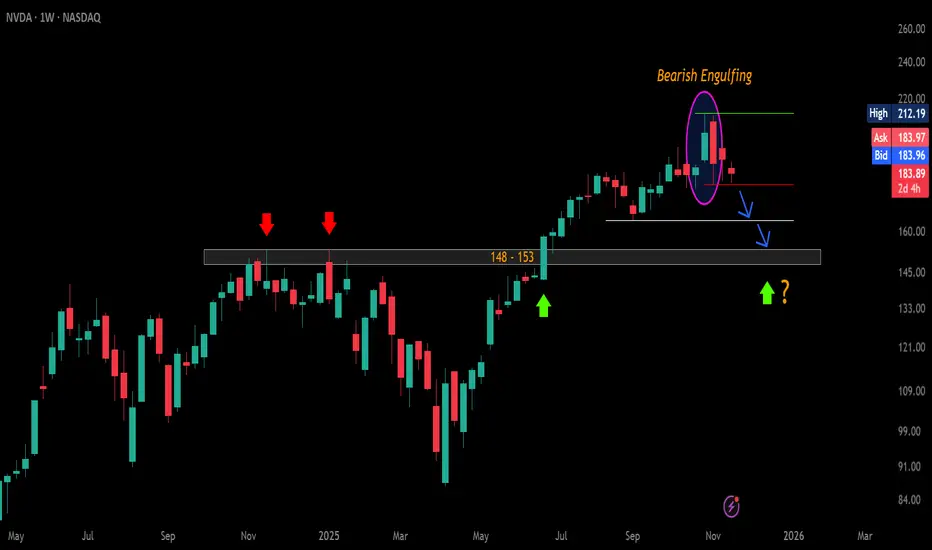
CMP: $184
NVDA has formed a Bearish Engulfing on the weekly chart and is currently trading inside the engulfed candle.
A WCB / sustained break below $178.91 will confirm the pattern → likely dragging price toward $164 and the major $153–$148 breakout-retest zone. 🔻
A WCB above the ATH $212.19 will invalidate the pattern and signal a fresh uptrend. 🚀
📌 Note: Q3 earnings to be announced post-market. 🕒
Bias: Short-term bearish, HTF bullish if $148–$153 holds. 💚
#USMarket #NVDA #Stocks #TechnicalAnalysis #PriceAction #BearishEngulfing
📌 #Disclaimer: This analysis is shared for educational purposes only. It is not a buy/sell recommendation. Please do your own research before making any trading decisions.
Declinazione di responsabilità
Le informazioni e le pubblicazioni non sono intese come, e non costituiscono, consulenza o raccomandazioni finanziarie, di investimento, di trading o di altro tipo fornite o approvate da TradingView. Per ulteriori informazioni, consultare i Termini di utilizzo.
Declinazione di responsabilità
Le informazioni e le pubblicazioni non sono intese come, e non costituiscono, consulenza o raccomandazioni finanziarie, di investimento, di trading o di altro tipo fornite o approvate da TradingView. Per ulteriori informazioni, consultare i Termini di utilizzo.