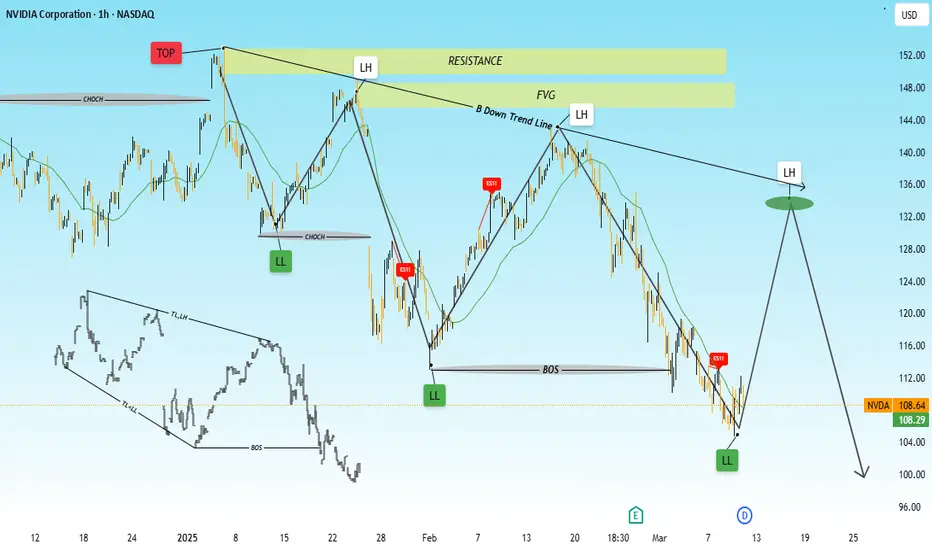
This chart appears to be a technical analysis of NVIDIA Corporation (NVDA) on the 1-hour timeframe. The tools and patterns applied include:
1. *Market Structure Concepts*:
- *Lower Highs (LH) and Lower Lows (LL)*: These indicate a downtrend.
- *Break of Structure (BOS)*: Suggests a shift in market direction.
- *Change of Character (CHOCH)*: A potential trend reversal signal.
2. *Support & Resistance*:
- *Resistance Zone*: Marked at the top where price previously reversed.
- *Fair Value Gap (FVG)*: Indicates an imbalance in price action, often leading to a reaction.
3. *Trendlines*:
- *Downtrend Line*: Connects lower highs to show the prevailing bearish trend.
4. *Indicators*:
- *Moving Averages*: Likely used to smooth price action and identify trend direction.
5. *Wyckoff/Fractal Structure*:
- The boxed schematic at the bottom left suggests a fractal or Wyckoff accumulation/distribution phase.
6. *Price Action Projection*:
- The projected path suggests a potential retracement to a lower high before another decline.
Would you like further insights on how to trade based on this analysis?
Declinazione di responsabilità
Le informazioni ed i contenuti pubblicati non costituiscono in alcun modo una sollecitazione ad investire o ad operare nei mercati finanziari. Non sono inoltre fornite o supportate da TradingView. Maggiori dettagli nelle Condizioni d'uso.
Declinazione di responsabilità
Le informazioni ed i contenuti pubblicati non costituiscono in alcun modo una sollecitazione ad investire o ad operare nei mercati finanziari. Non sono inoltre fornite o supportate da TradingView. Maggiori dettagli nelle Condizioni d'uso.
