Price Action & Setup (1-Hour Chart)
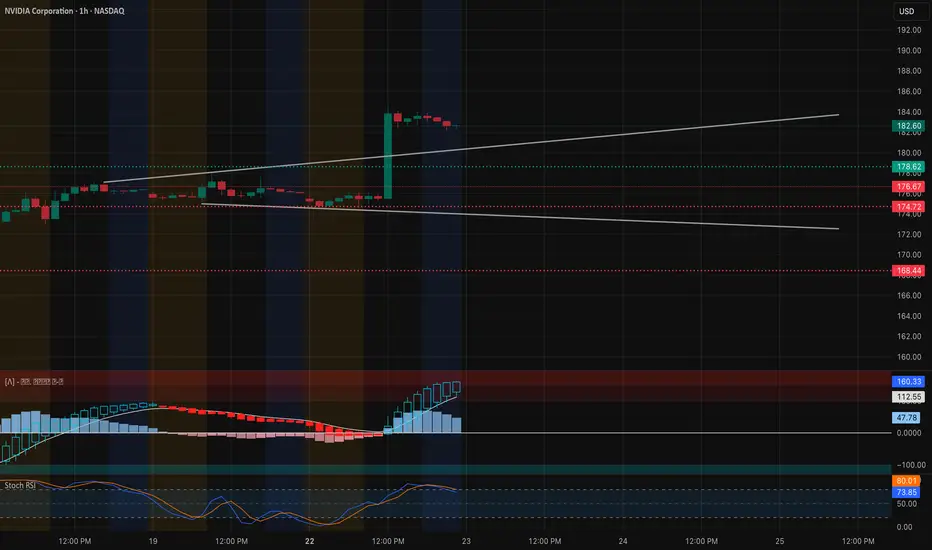
NVDA ripped early in today’s session, blasting through the mid-170s base and tagging 182–184 before cooling off. That surge printed a strong hourly impulse candle and left a shallow flag of lower highs, which often sets up the next leg if demand holds. Immediate intraday support sits around 178.6 and the breakout shelf at 176.6. Below that, 174.7 is a must-defend zone for bulls.
Momentum Check MACD on the 1-hour flipped positive with expanding histogram but is flattening, signaling short-term digestion. Stoch RSI is still hot (near 80+), so a brief pullback to reset isn’t out of the question. Volume on the breakout was convincing, showing real participation, but follow-through volume on the flag is key.

GEX (Options Flow) Confluence Gamma exposure backs the bullish case if 182.5 holds:
* Highest positive GEX / Call resistance: near 182.5
* 2nd Call Wall: ~185 (80% call concentration)
* 3rd Call Wall: ~190
* Put defense: 172.5 and 168.4 The dense call walls above mean that if NVDA stays pinned over 182.5, market makers may have to keep hedging upward, opening room toward 185 then possibly 190. A slip under 178–176 would instead drag toward the 172.5 put magnet.
Trading Plan
* Aggressive bull scalp: eye a break & hold above 182.6 → target 185 with tight stop under 180.8.
* Conservative entry: wait for a retest of 178.5–176.5 and a clean bounce before joining.
* Bearish hedge: if 176.5 fails on strong volume, consider a quick put play toward 172.5.
Option Angle Calls around 182.5–185 strike for this week stay attractive for momentum traders if NVDA grinds above 182.5. For protection or a counter-move, short-dated puts near 172.5 can work if breakdown triggers.
Bottom Line Bulls control momentum as long as NVDA holds 178–176. A decisive hourly close over 182.5 could spark a gamma-driven push toward 185–190. Lose 176.5 and the party cools fast.
Disclaimer: This is for educational discussion only and not financial advice. Always do your own research and manage risk.
Momentum Check MACD on the 1-hour flipped positive with expanding histogram but is flattening, signaling short-term digestion. Stoch RSI is still hot (near 80+), so a brief pullback to reset isn’t out of the question. Volume on the breakout was convincing, showing real participation, but follow-through volume on the flag is key.
GEX (Options Flow) Confluence Gamma exposure backs the bullish case if 182.5 holds:
* Highest positive GEX / Call resistance: near 182.5
* 2nd Call Wall: ~185 (80% call concentration)
* 3rd Call Wall: ~190
* Put defense: 172.5 and 168.4 The dense call walls above mean that if NVDA stays pinned over 182.5, market makers may have to keep hedging upward, opening room toward 185 then possibly 190. A slip under 178–176 would instead drag toward the 172.5 put magnet.
Trading Plan
* Aggressive bull scalp: eye a break & hold above 182.6 → target 185 with tight stop under 180.8.
* Conservative entry: wait for a retest of 178.5–176.5 and a clean bounce before joining.
* Bearish hedge: if 176.5 fails on strong volume, consider a quick put play toward 172.5.
Option Angle Calls around 182.5–185 strike for this week stay attractive for momentum traders if NVDA grinds above 182.5. For protection or a counter-move, short-dated puts near 172.5 can work if breakdown triggers.
Bottom Line Bulls control momentum as long as NVDA holds 178–176. A decisive hourly close over 182.5 could spark a gamma-driven push toward 185–190. Lose 176.5 and the party cools fast.
Disclaimer: This is for educational discussion only and not financial advice. Always do your own research and manage risk.
Declinazione di responsabilità
Le informazioni ed i contenuti pubblicati non costituiscono in alcun modo una sollecitazione ad investire o ad operare nei mercati finanziari. Non sono inoltre fornite o supportate da TradingView. Maggiori dettagli nelle Condizioni d'uso.
Declinazione di responsabilità
Le informazioni ed i contenuti pubblicati non costituiscono in alcun modo una sollecitazione ad investire o ad operare nei mercati finanziari. Non sono inoltre fornite o supportate da TradingView. Maggiori dettagli nelle Condizioni d'uso.