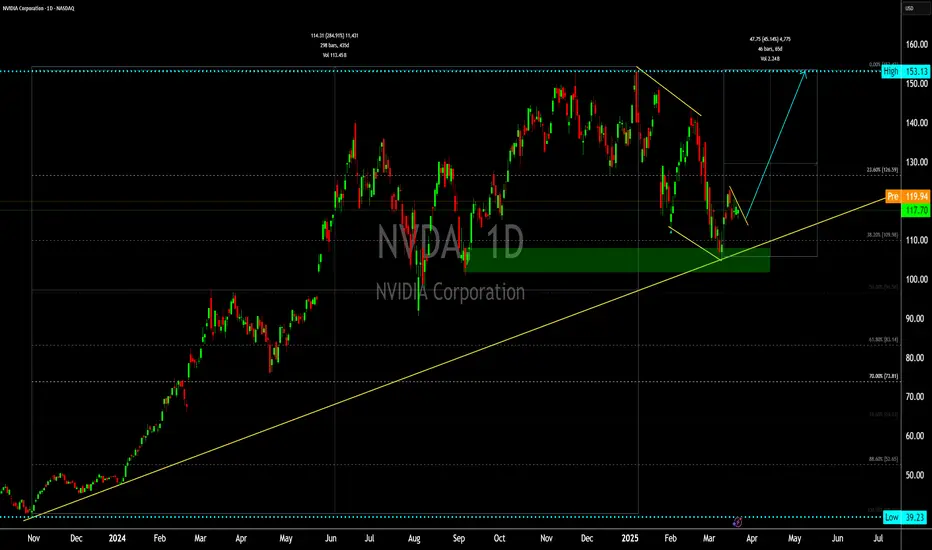
This chart presents a bullish setup for NVIDIA Corporation (NVDA) on the 1D (daily) timeframe. The setup is based on multiple technical analysis tools, which indicate a potential upward movement. Let's break it down:
1. Trendlines & Support Zone
Ascending Trendline (Yellow): A long-term uptrend support line connects previous price lows, indicating an overall bullish trend.
Green Support Zone: The price recently touched this demand area, showing that buyers are stepping in to push the price higher.
This trendline support + demand zone combination strengthens the case for a reversal.
2. Falling Wedge Pattern (Bullish Reversal)
The price formed a falling wedge (marked by two converging yellow trendlines).
A falling wedge is a classic bullish reversal pattern, meaning that once the price breaks above the wedge, an upward rally is expected.
The price broke out of the wedge and started moving higher, confirming a potential reversal.
3. Fibonacci Retracement Levels
The chart shows a Fibonacci retracement overlay, with key levels:
38.2% level (~$109.98): This acted as support.
23.6% level (~$126.59): A potential first target.
The price is currently rebounding from the 38.2% retracement, a strong area where buyers often enter.
4. Projected Price Target (Bullish Move)
Blue Arrow Projection: The blue line indicates the expected price path.
Target: $153.13 (High) – The price could aim for previous highs after confirmation of the breakout.
5. Volume Confirmation
A volume increase at the breakout suggests strong buying interest, further confirming the bullish bias.
Conclusion: Why This Is a Buy Setup?
✅ Strong Trendline Support → Buyers defending this area.
✅ Falling Wedge Breakout → Bullish reversal pattern confirmed.
✅ Fibonacci 38.2% Support → Key retracement level holding.
✅ Target Projection to $153.13 → High probability move.
This setup suggests that NVIDIA could continue moving upwards in the coming weeks if it maintains above support levels.
Nota
Nota
Nota
For Training visit.
Website wave-trader.com
Website techtradingacademy.com
Slack: wavetraders.slack.com
Telegram: t.me/Wavetraders
X: twitter.com/Wave__Trader
FB: facebook.com/WTimran
Website wave-trader.com
Website techtradingacademy.com
Slack: wavetraders.slack.com
Telegram: t.me/Wavetraders
X: twitter.com/Wave__Trader
FB: facebook.com/WTimran
Pubblicazioni correlate
Declinazione di responsabilità
Le informazioni e le pubblicazioni non sono intese come, e non costituiscono, consulenza o raccomandazioni finanziarie, di investimento, di trading o di altro tipo fornite o approvate da TradingView. Per ulteriori informazioni, consultare i Termini di utilizzo.