Based on the recent market news and Trump’s speech, here are a few technology stocks that could be worth watching:
Nvidia (NVDA)
* Why? Nvidia remains a dominant player in AI and GPU markets. Despite recent volatility due to tariff concerns, long-term demand for AI chips remains strong.
* Risk: Any tariffs on semiconductor imports could increase costs, but Nvidia’s pricing power could offset this.
Market Structure Overview:
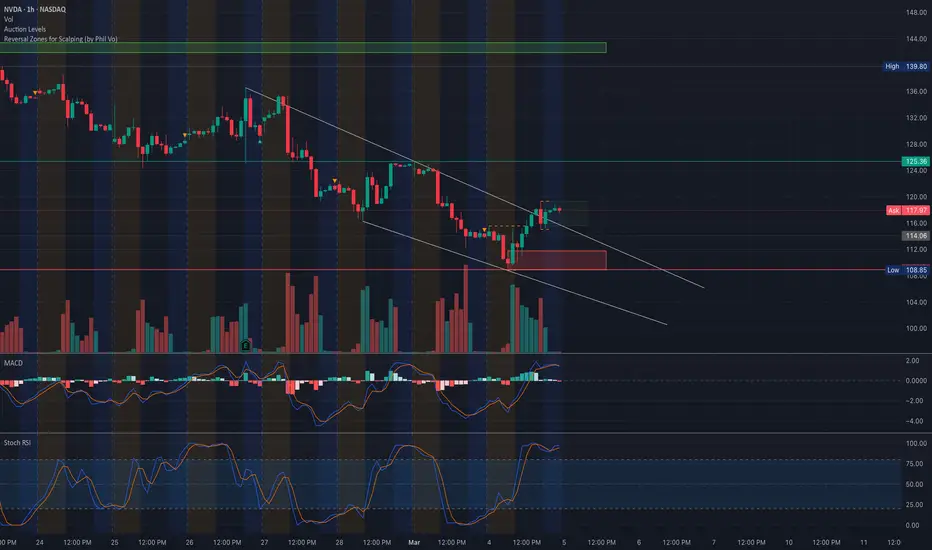
* NVDA has been trading in a descending channel, testing lower support zones.
* Recent price action suggests a potential breakout attempt, but it needs confirmation above $122-$125.
* A strong support zone around $110-$115 is holding, aligning with key volume profile areas.
Supply & Demand Zones:
* Support: $110-$115, major liquidity zone where buyers have stepped in.
* Resistance: $122-$125, aligning with the descending channel’s upper trendline and volume profile high.
Order Blocks & Volume Profile:
* POC (Point of Control): $115.96, indicating this level as a high-volume area.
* VAH (Value Area High): $125.36, which aligns with a breakout level.
* VAL (Value Area Low): $108.85, marking the last line of defense before a bigger drop.
Key Indicators:
* MACD: Showing early signs of bullish crossover, but not fully confirmed.
* Stoch RSI: Overbought, which may indicate a short-term pullback before a continuation.
* Volume: Increasing on the upside, suggesting a potential shift in momentum.
Options Flow & GEX Analysis

Gamma Exposure (GEX) Breakdown:
* Put Walls: Heavy put support at $110 & $115, indicating strong downside defense.
* Call Walls: Major resistance at $130 & $140, suggesting limited upside unless a breakout occurs.
* HVL (High Volatility Level): $122-$125, the key zone where price could see explosive movement.
Implied Volatility & Sentiment:
* IVR: 47.4, showing moderate IV levels.
* Options Oscillator: Call positioning is 14.3%, indicating bullish bets are picking up.
* GEX Signals: Still bearish but decreasing, which means potential for a reversal if buyers step in.
Trade Scenarios & Actionable Plan
Bullish Scenario:
* Entry: Break and hold above $122.
* Target 1: $125.36 (POC Resistance).
* Target 2: $130-$140 (Gamma Call Walls).
* Stop Loss: Below $115.96 (POC).
Bearish Scenario:
* Entry: Rejection at $122-$125.
* Target 1: $115.96 (POC Support).
* Target 2: $110 (Major PUT Wall).
* Stop Loss: Above $125.36.
Final Thoughts & Market Direction
* If NVDA clears $122-$125, we could see a strong push towards $130+.
* If it fails, expect a retest of $115-$110 before another attempt.
* Watch volume and options flow for directional bias confirmation.
🚨 Stay cautious with stop losses and watch the breakout zones! 🚨
📌 Disclaimer:
This analysis is for educational purposes only and does not constitute financial advice. Always do your own research and manage risk accordingly before trading. 🚀📉
Nvidia (NVDA)
* Why? Nvidia remains a dominant player in AI and GPU markets. Despite recent volatility due to tariff concerns, long-term demand for AI chips remains strong.
* Risk: Any tariffs on semiconductor imports could increase costs, but Nvidia’s pricing power could offset this.
Market Structure Overview:
* NVDA has been trading in a descending channel, testing lower support zones.
* Recent price action suggests a potential breakout attempt, but it needs confirmation above $122-$125.
* A strong support zone around $110-$115 is holding, aligning with key volume profile areas.
Supply & Demand Zones:
* Support: $110-$115, major liquidity zone where buyers have stepped in.
* Resistance: $122-$125, aligning with the descending channel’s upper trendline and volume profile high.
Order Blocks & Volume Profile:
* POC (Point of Control): $115.96, indicating this level as a high-volume area.
* VAH (Value Area High): $125.36, which aligns with a breakout level.
* VAL (Value Area Low): $108.85, marking the last line of defense before a bigger drop.
Key Indicators:
* MACD: Showing early signs of bullish crossover, but not fully confirmed.
* Stoch RSI: Overbought, which may indicate a short-term pullback before a continuation.
* Volume: Increasing on the upside, suggesting a potential shift in momentum.
Options Flow & GEX Analysis
Gamma Exposure (GEX) Breakdown:
* Put Walls: Heavy put support at $110 & $115, indicating strong downside defense.
* Call Walls: Major resistance at $130 & $140, suggesting limited upside unless a breakout occurs.
* HVL (High Volatility Level): $122-$125, the key zone where price could see explosive movement.
Implied Volatility & Sentiment:
* IVR: 47.4, showing moderate IV levels.
* Options Oscillator: Call positioning is 14.3%, indicating bullish bets are picking up.
* GEX Signals: Still bearish but decreasing, which means potential for a reversal if buyers step in.
Trade Scenarios & Actionable Plan
Bullish Scenario:
* Entry: Break and hold above $122.
* Target 1: $125.36 (POC Resistance).
* Target 2: $130-$140 (Gamma Call Walls).
* Stop Loss: Below $115.96 (POC).
Bearish Scenario:
* Entry: Rejection at $122-$125.
* Target 1: $115.96 (POC Support).
* Target 2: $110 (Major PUT Wall).
* Stop Loss: Above $125.36.
Final Thoughts & Market Direction
* If NVDA clears $122-$125, we could see a strong push towards $130+.
* If it fails, expect a retest of $115-$110 before another attempt.
* Watch volume and options flow for directional bias confirmation.
🚨 Stay cautious with stop losses and watch the breakout zones! 🚨
📌 Disclaimer:
This analysis is for educational purposes only and does not constitute financial advice. Always do your own research and manage risk accordingly before trading. 🚀📉
Declinazione di responsabilità
Le informazioni ed i contenuti pubblicati non costituiscono in alcun modo una sollecitazione ad investire o ad operare nei mercati finanziari. Non sono inoltre fornite o supportate da TradingView. Maggiori dettagli nelle Condizioni d'uso.
Declinazione di responsabilità
Le informazioni ed i contenuti pubblicati non costituiscono in alcun modo una sollecitazione ad investire o ad operare nei mercati finanziari. Non sono inoltre fornite o supportate da TradingView. Maggiori dettagli nelle Condizioni d'uso.