Trend Overview:
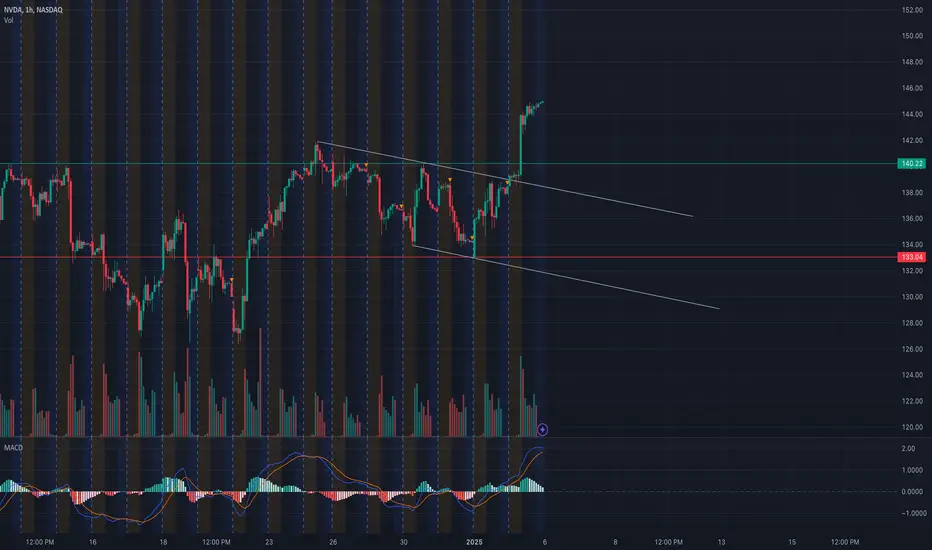
* Current Price Action: NVDA has shown strong bullish momentum, breaking out of a descending trendline on the 1-hour chart. The price has climbed towards significant resistance levels at $145 and $150, indicating robust buying pressure.
* Support Levels: Key support zones are identified at $136 and $133.04. These levels are pivotal if the price sees a pullback.
* Resistance Levels: The immediate resistance lies at $145, followed by $150, which aligns with a psychological and GEX barrier.
Indicators:
* MACD: The MACD on the hourly timeframe indicates a bullish crossover, suggesting upward momentum.
* Volume: Increasing volume supports the breakout above resistance.
* RSI: RSI is nearing overbought territory, warranting caution for a potential pullback.
Scenarios for Tomorrow:
1. Bullish Scenario: If NVDA sustains above $145, it could rally to test $150.
* Entry: Above $145
* Target: $150
* Stop Loss: Below $142
2. Bearish Scenario: A rejection from $145 may lead to a retracement toward $136.
* Entry: Below $143
* Target: $136
* Stop Loss: Above $145

GEX Analysis for Options Trading:
Gamma Exposure (GEX):
* Call Walls:
* Significant resistance at $150, with substantial call positioning.
* $145 also shows elevated gamma exposure, indicating strong option market activity.
* Put Walls:
* Support levels are anchored around $136 and $133, where gamma hedging by market makers could slow downward movement.
Options Strategy for January 6:
1. Bullish Play:
* Strategy: Buy Calls
* Strike Price: $145
* Expiration Date: Closest weekly expiration
* Target: $150
2. Bearish Play:
* Strategy: Buy Puts
* Strike Price: $140
* Expiration Date: Closest weekly expiration
* Target: $136
Disclaimer:
This analysis is for educational purposes only and does not constitute financial advice. Always conduct your own research and manage risk appropriately.
* Current Price Action: NVDA has shown strong bullish momentum, breaking out of a descending trendline on the 1-hour chart. The price has climbed towards significant resistance levels at $145 and $150, indicating robust buying pressure.
* Support Levels: Key support zones are identified at $136 and $133.04. These levels are pivotal if the price sees a pullback.
* Resistance Levels: The immediate resistance lies at $145, followed by $150, which aligns with a psychological and GEX barrier.
Indicators:
* MACD: The MACD on the hourly timeframe indicates a bullish crossover, suggesting upward momentum.
* Volume: Increasing volume supports the breakout above resistance.
* RSI: RSI is nearing overbought territory, warranting caution for a potential pullback.
Scenarios for Tomorrow:
1. Bullish Scenario: If NVDA sustains above $145, it could rally to test $150.
* Entry: Above $145
* Target: $150
* Stop Loss: Below $142
2. Bearish Scenario: A rejection from $145 may lead to a retracement toward $136.
* Entry: Below $143
* Target: $136
* Stop Loss: Above $145
GEX Analysis for Options Trading:
Gamma Exposure (GEX):
* Call Walls:
* Significant resistance at $150, with substantial call positioning.
* $145 also shows elevated gamma exposure, indicating strong option market activity.
* Put Walls:
* Support levels are anchored around $136 and $133, where gamma hedging by market makers could slow downward movement.
Options Strategy for January 6:
1. Bullish Play:
* Strategy: Buy Calls
* Strike Price: $145
* Expiration Date: Closest weekly expiration
* Target: $150
2. Bearish Play:
* Strategy: Buy Puts
* Strike Price: $140
* Expiration Date: Closest weekly expiration
* Target: $136
Disclaimer:
This analysis is for educational purposes only and does not constitute financial advice. Always conduct your own research and manage risk appropriately.
Declinazione di responsabilità
Le informazioni ed i contenuti pubblicati non costituiscono in alcun modo una sollecitazione ad investire o ad operare nei mercati finanziari. Non sono inoltre fornite o supportate da TradingView. Maggiori dettagli nelle Condizioni d'uso.
Declinazione di responsabilità
Le informazioni ed i contenuti pubblicati non costituiscono in alcun modo una sollecitazione ad investire o ad operare nei mercati finanziari. Non sono inoltre fornite o supportate da TradingView. Maggiori dettagli nelle Condizioni d'uso.