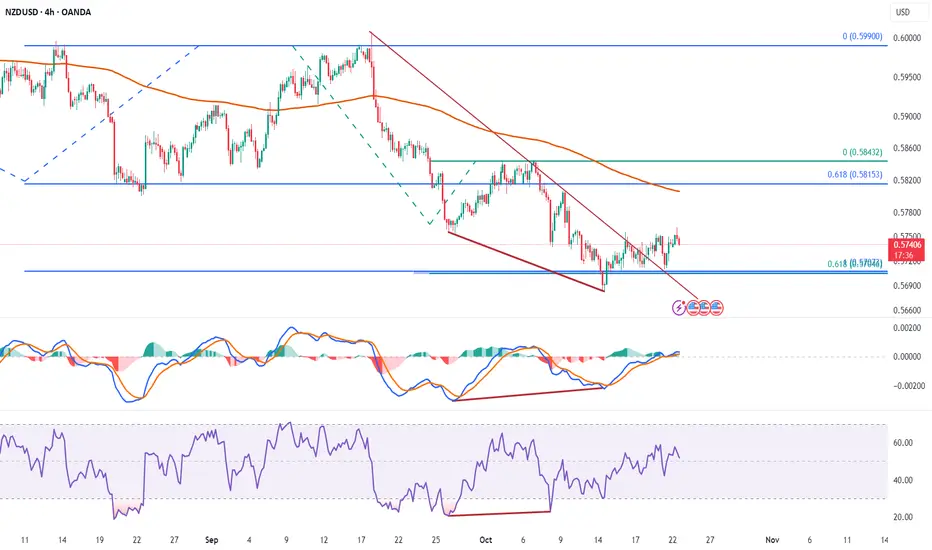
NZDUSD has been under sustained pressure for weeks but is now showing early signs of a potential major reversal. On the monthly timeframe, price has formed a triple bottom pattern, suggesting a strong accumulation phase near the 0.5700 area — a historically defended level.
On the 4H chart, price is showing exhaustion of sellers. The MACD shows a bullish crossover, and RSI confirms a bullish divergence, hinting that selling momentum is fading.
A breakout above the descending channel could confirm a medium-term trend reversal, with upside potential toward the 200 EMA and beyond.
Resistance levels:
0.6118
0.5815
0.5990
Support levels:
0.5707
0.5618
0.5532
Declinazione di responsabilità
Le informazioni ed i contenuti pubblicati non costituiscono in alcun modo una sollecitazione ad investire o ad operare nei mercati finanziari. Non sono inoltre fornite o supportate da TradingView. Maggiori dettagli nelle Condizioni d'uso.
Declinazione di responsabilità
Le informazioni ed i contenuti pubblicati non costituiscono in alcun modo una sollecitazione ad investire o ad operare nei mercati finanziari. Non sono inoltre fornite o supportate da TradingView. Maggiori dettagli nelle Condizioni d'uso.