⚡ OLECTRA – Wave C Completion Zone Hit | Is a Strong Reversal & Wave C Rally Coming?
🧠 Overall Chart Context
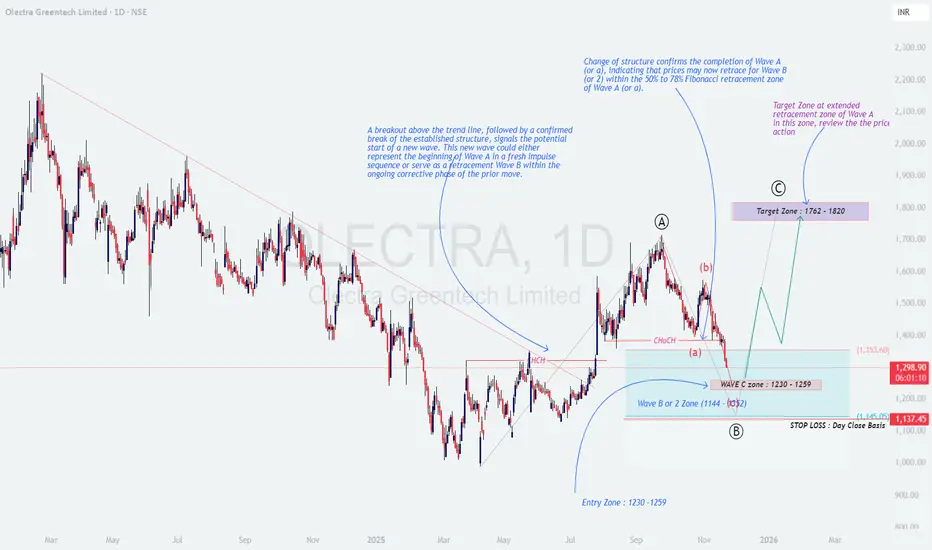
The chart of Olectra Greentech Ltd (1D) shows a well-defined Elliott Wave corrective structure, where price has now entered the expected Wave C completion zone (₹1230–₹1259).
This zone aligns with strong demand + Fibonacci confluence, suggesting a potential end of Wave B/2 and the beginning of a new Wave C impulse.
📌 Price previously made:
A clean Change of Character (ChoCH) → signaling completion of Wave A.
A retracement to the 50–78% retracement zone → forming Wave (b).
A steady fall into Wave C demand zone → now approaching support.
📚 Educational Insights
🎯 Prediction & Targets
If OLECTRA sustains above the ₹1230–₹1259 support zone, a new Wave C rally may unfold.
🎯 First Profit Zone: ₹1,760 – ₹1,820
🎯 Extended Target: ₹1,900+ (if momentum continues)
🛑 Stop Loss: Close below ₹1,137 (invalidates Wave B/2 structure)
💡 Trading Strategy (Educational Purpose Only)
🧩 Summary & Outlook
OLECTRA has entered the crucial Wave C completion zone, which is a high-probability reversal area.
If momentum builds from this demand zone, price may begin a fresh Wave C impulse, aiming for ₹1760–₹1820 in the coming weeks.
A breakout above ₹1353 will act as the early confirmation trigger 🔥.
⚠️ Disclaimer
I am not a SEBI-registered analyst.
This analysis is for educational purposes only — not investment advice.
🧠 Overall Chart Context
The chart of Olectra Greentech Ltd (1D) shows a well-defined Elliott Wave corrective structure, where price has now entered the expected Wave C completion zone (₹1230–₹1259).
This zone aligns with strong demand + Fibonacci confluence, suggesting a potential end of Wave B/2 and the beginning of a new Wave C impulse.
📌 Price previously made:
A clean Change of Character (ChoCH) → signaling completion of Wave A.
A retracement to the 50–78% retracement zone → forming Wave (b).
A steady fall into Wave C demand zone → now approaching support.
📚 Educational Insights
- 📘 Change of Structure (ChoCH):
A confirmed break of previous swing highs indicates the first shift from bearish to bullish structure — often the start of new wave formation. - ✨ Wave A–B–C Corrections:
Wave B typically retraces 50–78% of Wave A, while Wave C often equals Wave A in size. This structure is playing out perfectly here. - 🌀 Extended Retracement Zones:
When prices fall into strong demand (like ₹1230–₹1260), these zones often create big reversal opportunities in impulsive markets.
🎯 Prediction & Targets
If OLECTRA sustains above the ₹1230–₹1259 support zone, a new Wave C rally may unfold.
🎯 First Profit Zone: ₹1,760 – ₹1,820
🎯 Extended Target: ₹1,900+ (if momentum continues)
🛑 Stop Loss: Close below ₹1,137 (invalidates Wave B/2 structure)
💡 Trading Strategy (Educational Purpose Only)
- 🟢 Entry Zone: ₹1230–₹1259
Wait for reversal candles (hammer, engulfing) or a bullish ChoCH on lower timeframes. - 📈 Confirmation:
A break above ₹1,353 strengthens the probability of Wave C starting. - 🎯 Targets:
• First Target → ₹1762–₹1820
• Extended Target → ₹1900+ - ⚖️ Risk Plan:
Risk only 1–2% of capital.
Stick to closing-basis SL at ₹1,137.
🧩 Summary & Outlook
OLECTRA has entered the crucial Wave C completion zone, which is a high-probability reversal area.
If momentum builds from this demand zone, price may begin a fresh Wave C impulse, aiming for ₹1760–₹1820 in the coming weeks.
A breakout above ₹1353 will act as the early confirmation trigger 🔥.
⚠️ Disclaimer
I am not a SEBI-registered analyst.
This analysis is for educational purposes only — not investment advice.
Declinazione di responsabilità
Le informazioni e le pubblicazioni non sono intese come, e non costituiscono, consulenza o raccomandazioni finanziarie, di investimento, di trading o di altro tipo fornite o approvate da TradingView. Per ulteriori informazioni, consultare i Termini di utilizzo.
Declinazione di responsabilità
Le informazioni e le pubblicazioni non sono intese come, e non costituiscono, consulenza o raccomandazioni finanziarie, di investimento, di trading o di altro tipo fornite o approvate da TradingView. Per ulteriori informazioni, consultare i Termini di utilizzo.