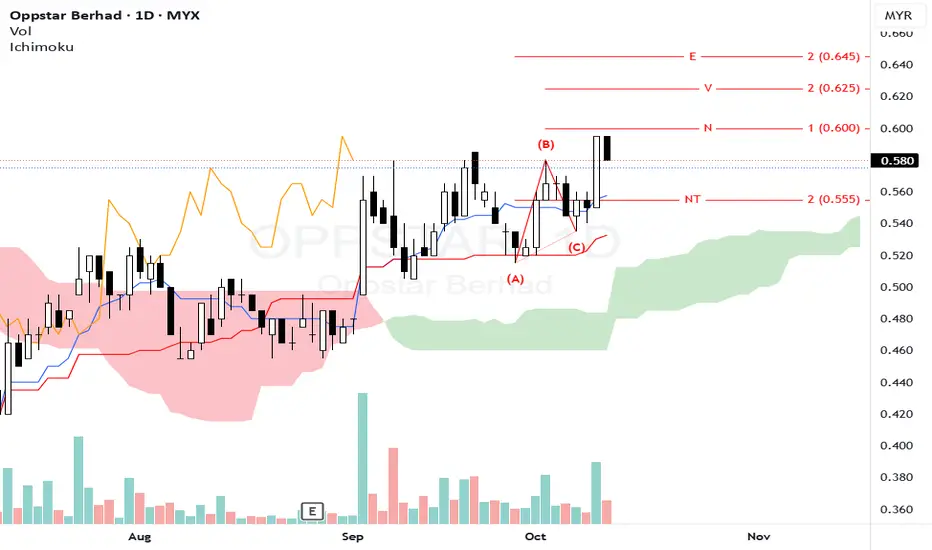
The stock is in an uptrend after a consolidation, with price around 0.58.
Price is testing the NT zone (0.555–0.565) with recent higher highs, indicating a potential setup for continuation if breakout occurs.
Kumo sits below and offers support; price is trading above the Kumo boundary in a favorable context.
Volume has shown spikes on rallies; confirm breakout with sustained volume.
The N-wave suggests a corrective pullback followed by continuation. A break above NT would suggest progression toward N, then V, and possibly E.
Key levels:
Resistance: NT at ~0.555-0.565, then N at ~0.600, V at ~0.625, E at ~0.645
Support: Near-term support near 0.540-0.550 and the Kumo lower edge.
Signals to watch:
Bullish confirmation if there is a daily close above 0.565 with higher volume
Failure to clear NT or a drop back under 0.550 would weaken the setup.
Entry: Enter long on a decisive breakout above 0.565-0.570 with strong volume and bullish candlestick price action.
Stop Loss: Place SL below the NT level, around 0.545-0.550 (or below the Kumo lower boundary for tighter risk).
If price fails to stay above 0.565 or volume does not pick up, consider waiting for a pullback and a safer entry near 0.550.
Notes:
1. Analysis for education purpose only.
2. Trade at your own risk.
Trade chiuso: stop raggiunto
Hit SLDeclinazione di responsabilità
Le informazioni e le pubblicazioni non sono intese come, e non costituiscono, consulenza o raccomandazioni finanziarie, di investimento, di trading o di altro tipo fornite o approvate da TradingView. Per ulteriori informazioni, consultare i Termini di utilizzo.
Declinazione di responsabilità
Le informazioni e le pubblicazioni non sono intese come, e non costituiscono, consulenza o raccomandazioni finanziarie, di investimento, di trading o di altro tipo fornite o approvate da TradingView. Per ulteriori informazioni, consultare i Termini di utilizzo.
