Hello guys!
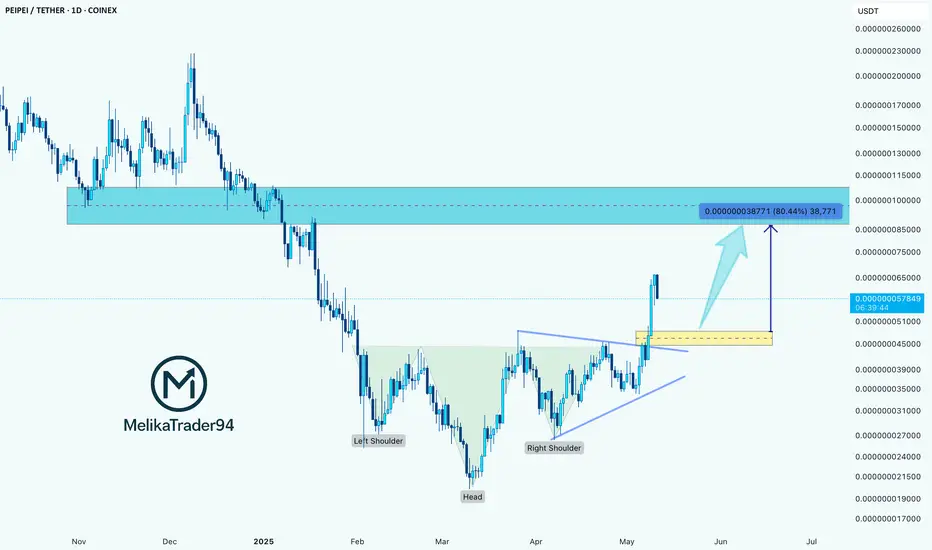
The PEiPEi/USDT daily chart presents a textbook inverse head and shoulders pattern, a classic bullish reversal formation. The structure is clearly labeled on the chart:
Key Zones:
The PEiPEi/USDT daily chart presents a textbook inverse head and shoulders pattern, a classic bullish reversal formation. The structure is clearly labeled on the chart:
- Left Shoulder: Formed in late January.
- Head: Deep retracement bottoming in early March.
- Right Shoulder: Completed in April with higher lows.
- Neckline: Shown with a breakout accompanied by strong bullish momentum.
- Following the breakout above the neckline, price action surged, breaking above a consolidation wedge and validating the pattern. The breakout is supported by volume and momentum, indicating strong bullish conviction.
Key Zones:
- Breakout Level (Yellow Box): Around 0.000000045 – 0.000000050 USDT, acting as immediate support on a retest.
- Target Zone (Blue Box): Marked around 0.000000085 – 0.000000100 USDT, representing a projected 80% upside move from the breakout point. This target aligns with a previous major supply/resistance zone from late 2024.
Trade attivo
Proud ThinkMarkets Ambassador -> Discover & Grow: bit.ly/Think-Markets
------
My recommended Exchange -> YEX: bit.ly/YEX-M
------
Telegram channel: t.me/melikatrader94
Forex channel: t.me/melikatrader94GoldForex
------
My recommended Exchange -> YEX: bit.ly/YEX-M
------
Telegram channel: t.me/melikatrader94
Forex channel: t.me/melikatrader94GoldForex
Pubblicazioni correlate
Declinazione di responsabilità
Le informazioni e le pubblicazioni non sono intese come, e non costituiscono, consulenza o raccomandazioni finanziarie, di investimento, di trading o di altro tipo fornite o approvate da TradingView. Per ulteriori informazioni, consultare i Termini di utilizzo.