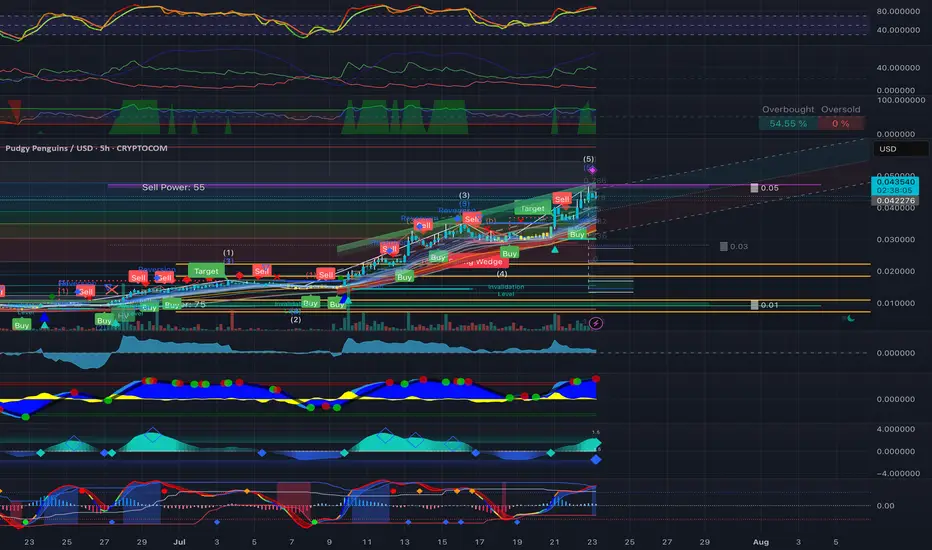
Using the new impulse base of $0.0079 and the confirmed 4.65× multiplier, the recalculated high is:
- $0.0079 × 4.65 = $0.036735
All technical zones are now recalibrated off this updated anchor structure.
PENGU Technical Breakdown – 4.65x Anchor at $0.0079
🔹 Price Anchors
• Impulse Base (Confirmed): $0.0079
• Target High (Multiplier 4.65x): $0.036735
• Current Price: Refer to real-time chart
• Last Known Local Low: $0.0079 (confirmed base)
📐 Fibonacci Retracement ($0.036735 → $0.0079)
• 0.236: $0.030218
• 0.382: $0.026242
• 0.500: $0.022318
• 0.618: $0.018394
• 0.786: $0.013693
• 1.000: $0.0079
🎯 Fibonacci Extensions (if $0.036735 is reclaimed and exceeded)
• 1.618: $0.060973
• 2.618: $0.096211
• 3.618: $0.131449
📊 Indicators (1D)
• RSI: Monitor reclaim of 50–55 zone for upside unlock
• MACD: Bullish confirmation pending crossover and histogram slope
• Volume: Accumulation baseline rising; breakout requires >20-day average spike
🔑 Critical Price Zones
• Hard Support: $0.0079 (macro base)
• Reversal Trigger: $0.013693 (0.786 reclaim)
• Initial Momentum Zone: $0.018394 (0.618 zone)
• Full Breakout Confirmation: $0.022318 (0.5 reclaim with volume)
⏱ Time Projections (Post-Zone Breach)
• $0.018394 Zone: 6–9 days post $0.0136 reclaim
• $0.022318 Flip: 2–3 weeks under strength
• $0.036735 Retest: 5–6 weeks
• $0.060973 Extension: 7–9 weeks
❌ Invalidation Criteria
• Daily close < $0.0079 invalidates upside structure
• Momentum structure broken below this base
✅ Execution Model – Fibonacci Format
1. Entry Zone: Daily close > $0.013693 with volume acceleration
2. Stop Level: $0.0077 (beneath impulse floor)
3. TP Levels:
• TP1: $0.018394
• TP2: $0.022318
• TP3: $0.036735
• TP4: $0.060973
Recalibrated using $0.0079 impulse anchor and 4.65 multiplier. All Fibonacci zones structurally aligned.
Avange-Lina
Declinazione di responsabilità
Le informazioni e le pubblicazioni non sono intese come, e non costituiscono, consulenza o raccomandazioni finanziarie, di investimento, di trading o di altro tipo fornite o approvate da TradingView. Per ulteriori informazioni, consultare i Termini di utilizzo.