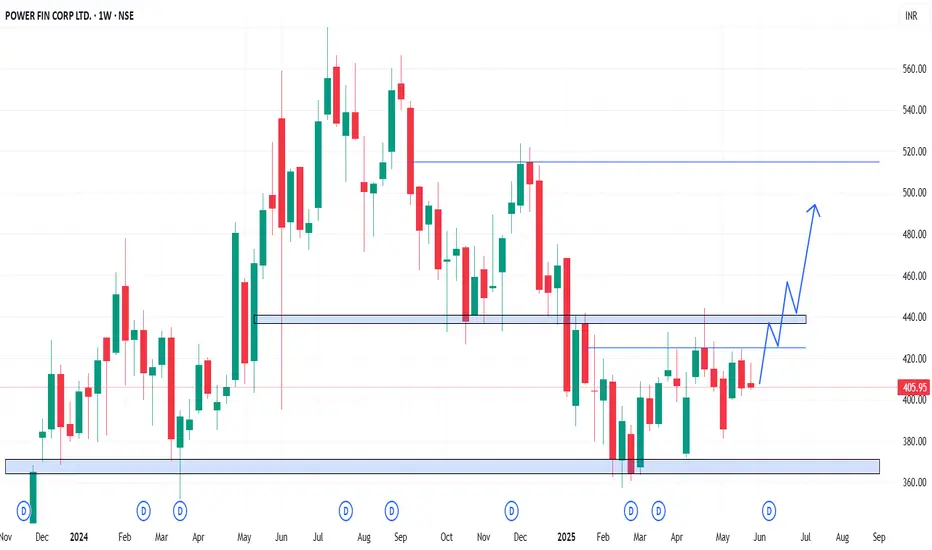
In the Weekly Chart of PFC ,
we can see that; 420-425 levels has shown strong rejection but selling has not been strong as per rejection.
Above 420 it ill bullish till 520 levels.
Trade as per your and Analysis
Expected momentum is shown in chart.
we can see that; 420-425 levels has shown strong rejection but selling has not been strong as per rejection.
Above 420 it ill bullish till 520 levels.
Trade as per your and Analysis
Expected momentum is shown in chart.
Declinazione di responsabilità
Le informazioni ed i contenuti pubblicati non costituiscono in alcun modo una sollecitazione ad investire o ad operare nei mercati finanziari. Non sono inoltre fornite o supportate da TradingView. Maggiori dettagli nelle Condizioni d'uso.
Declinazione di responsabilità
Le informazioni ed i contenuti pubblicati non costituiscono in alcun modo una sollecitazione ad investire o ad operare nei mercati finanziari. Non sono inoltre fornite o supportate da TradingView. Maggiori dettagli nelle Condizioni d'uso.