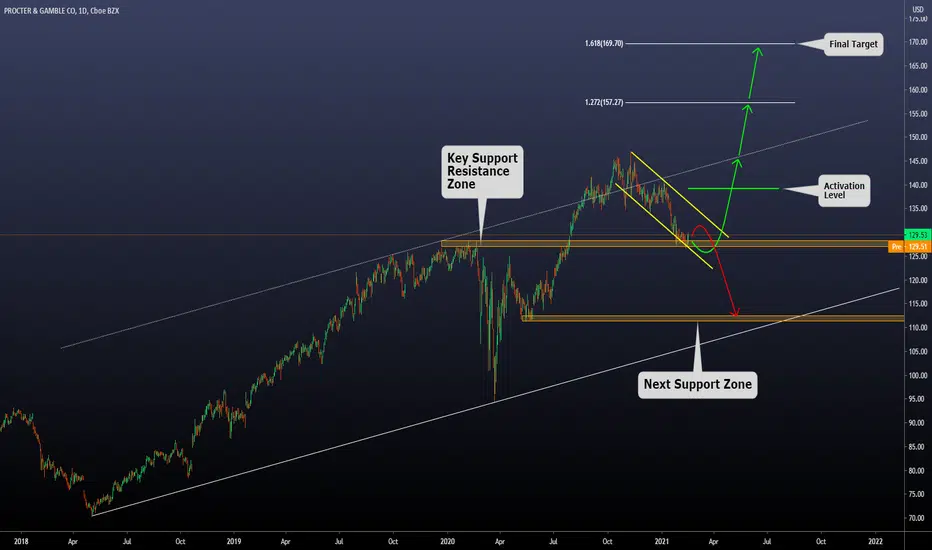
Today, we will use the Daily chart to understand Bullish and Bearish directions on this stock
a) Currently, the price is on a Key Support/Resistance zone, and we can expect a bounce or a breakout
b) If we have a breakout of the current level, the next level we can find support is 112 - 110
c) If the price bounces on the support zone, we have 3 levels to pay attention to and a final target on 170
d) In case we have a bearish breakout, we will wait for the price to reach the next support zone before developing new setups.
e) In case we have a bounce on the current level, we will wait for a bullish breakout of the current flag pattern, and we will use the green line as the activation level. Final target on 170 / Stop loss below the Flag Pattern
Thanks for reading!
Declinazione di responsabilità
Le informazioni ed i contenuti pubblicati non costituiscono in alcun modo una sollecitazione ad investire o ad operare nei mercati finanziari. Non sono inoltre fornite o supportate da TradingView. Maggiori dettagli nelle Condizioni d'uso.
Declinazione di responsabilità
Le informazioni ed i contenuti pubblicati non costituiscono in alcun modo una sollecitazione ad investire o ad operare nei mercati finanziari. Non sono inoltre fornite o supportate da TradingView. Maggiori dettagli nelle Condizioni d'uso.