I saw a Lance B video saying that fibonacci is garbage that people use with a confirmation bias, and it doesn't work. (He says, anything besides the 50% FIB). His thesis is that fibonacci is a phenomenum from nature and at some point traders decide to test and apply it in markets.
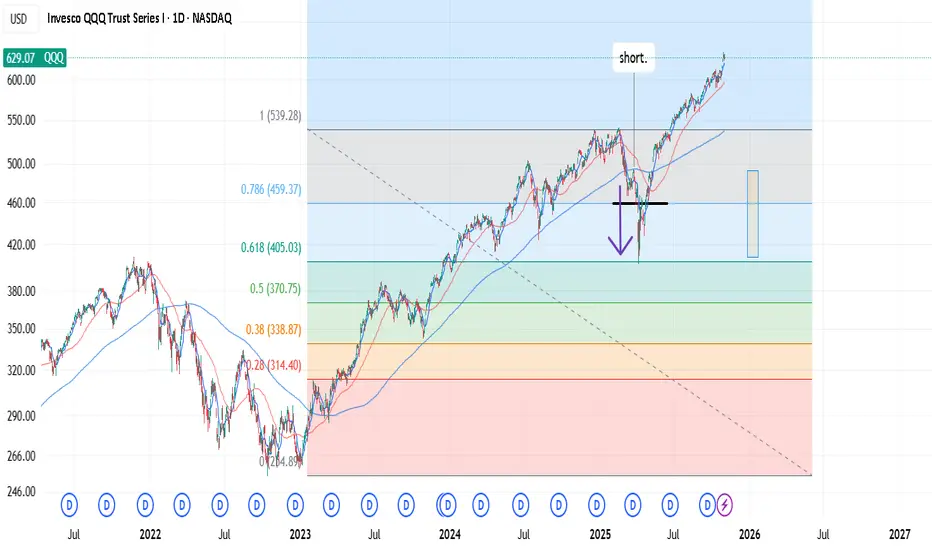
I disagree. Using LOG trend, during corrections, prices respect the fib level ratio. It's math, more or less. I only trade tickers, if the moves are in the correlation with whole market (index). I also think, it's practical only on corrections, bear markets. 🤔
-> When the "key" level breaks, it tests the next level. Which isn't practical due to high variance.
-> which means, you build the shorts during last resistance. Where market forces pull over. (50dma death cross as a force).
(Your hedge is the inertia from 50dma DC).
I think this is a cool, powerful setup to keep it mind. 👏
Nota

to test myself, I apply this on the 2008 market.
You can see the price push trough several levels of the "ratio". Also breaking the 50% FIB?
it's probably the only indicator I would trust for shorting things?
nice setups.
Nota

for SPX.
Nota

2000: more awkward but still.
Nota

2020: Have to zoom in for shorter period. Awkward as well, but markets dont need to be ideal.
Nota

2022: this one is probably the most awkward, next to 2000. Divergence in
why awkward: because it bounced. Strong markets dont die easily?
Nota
the bounce is what I call a "HOPE 🍀" period?People see strength, despite not ideal setup (death-cross). Tightening Cycle (QT), UKR War (rising
It's an interesting market dynamic to learn from.
Mega bull -> break of the trend... "Correction" -> Strong Bounce -> Lower High (..correction or beginning of a bear).
"GREED 😂" -> "FEAR🛑" (Deathcross) -> HOPE 🍀 -> 🐻
(Not sure if to sell (holding to positions)...hate to wait --> Bad risk-reward to buy. Hate losing. Hate to wait. --> FOMO, missed positions? hate to wait).
Nota
*Fact check: All these graphs are cherry picked corrections. -> it's because you want to short large extensions that has power to fall, not minor corrections. Hence they are rare. hence "cherry picked":)When stocks EXTEND (we already had a correction in this April) + 50DMA Deathcross or peaking 200dma -> this setup is way to go.
Nota


FACTORS of: Extended 10/20/50. with a break of 10/20, usually a good indicator for tops?
Nota
"Extended 10/20/50. with a break of 10/20"didnt apply to 2008 crash, because no ATH.
Applies to 2022, 2020. 2000.
Pubblicazioni correlate
Declinazione di responsabilità
Le informazioni e le pubblicazioni non sono intese come, e non costituiscono, consulenza o raccomandazioni finanziarie, di investimento, di trading o di altro tipo fornite o approvate da TradingView. Per ulteriori informazioni, consultare i Termini di utilizzo.