Market Structure and Price Action
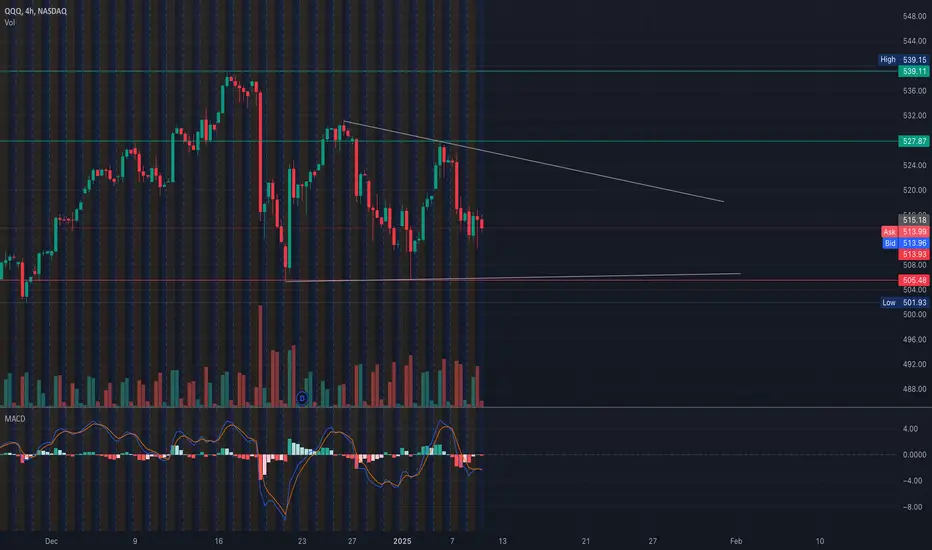
QQQ is currently trading below the critical resistance level of $527.87, with a descending trendline that aligns with recent lower highs. This reflects bearish momentum in the short term. Support at $513 has been tested multiple times, indicating buyer interest around that area.
The recent price movement suggests consolidation within a descending triangle, which is typically a bearish continuation pattern. However, a strong breakout above the trendline could invalidate this structure and lead to upward momentum.
Support and Resistance Levels
1. Resistance:
* $527.87 (major horizontal resistance).
* $522 (aligned with GEX and 2nd Call Wall).
2. Support:
* $513 (highest negative NETGEX and PUT Support).
* $505.48 - $504.40 (lower boundary of the triangle and 3rd PUT Wall).
Gamma Exposure (GEX) Analysis

* Call Resistance: $514 - $522 levels show minimal gamma exposure to calls, with 33.53% GEX aligning with $514.
* Put Walls: Significant negative GEX exposure at $513 and $510, marking these as critical support zones.
* Directional Bias: GEX structure leans bearish, with PUT dominance around current levels.
Indicators Overview
* MACD: Bearish crossover, signaling downward momentum, but with a possibility of consolidation if histogram bars begin shrinking.
* Volume: Declining, suggesting weakening conviction in the recent price movements.
Trade Scenarios
1. Bullish Scenario:
* Entry: Above $514, with confirmation of strong volume.
* Targets: $522 and $527.87.
* Stop-Loss: Below $510.
2. Bearish Scenario:
* Entry: Breakdown below $513.
* Targets: $505.48 and $504.40.
* Stop-Loss: Above $514.
Conclusion
QQQ is trading within a consolidation pattern with bearish pressure. Key levels to watch are $513 for breakdowns and $514 for potential breakouts. Gamma positioning supports bearish bias, but sharp moves can invalidate the analysis.
Disclaimer: This analysis is for educational purposes only and does not constitute financial advice. Always conduct your own research and risk management.
QQQ is currently trading below the critical resistance level of $527.87, with a descending trendline that aligns with recent lower highs. This reflects bearish momentum in the short term. Support at $513 has been tested multiple times, indicating buyer interest around that area.
The recent price movement suggests consolidation within a descending triangle, which is typically a bearish continuation pattern. However, a strong breakout above the trendline could invalidate this structure and lead to upward momentum.
Support and Resistance Levels
1. Resistance:
* $527.87 (major horizontal resistance).
* $522 (aligned with GEX and 2nd Call Wall).
2. Support:
* $513 (highest negative NETGEX and PUT Support).
* $505.48 - $504.40 (lower boundary of the triangle and 3rd PUT Wall).
Gamma Exposure (GEX) Analysis
* Call Resistance: $514 - $522 levels show minimal gamma exposure to calls, with 33.53% GEX aligning with $514.
* Put Walls: Significant negative GEX exposure at $513 and $510, marking these as critical support zones.
* Directional Bias: GEX structure leans bearish, with PUT dominance around current levels.
Indicators Overview
* MACD: Bearish crossover, signaling downward momentum, but with a possibility of consolidation if histogram bars begin shrinking.
* Volume: Declining, suggesting weakening conviction in the recent price movements.
Trade Scenarios
1. Bullish Scenario:
* Entry: Above $514, with confirmation of strong volume.
* Targets: $522 and $527.87.
* Stop-Loss: Below $510.
2. Bearish Scenario:
* Entry: Breakdown below $513.
* Targets: $505.48 and $504.40.
* Stop-Loss: Above $514.
Conclusion
QQQ is trading within a consolidation pattern with bearish pressure. Key levels to watch are $513 for breakdowns and $514 for potential breakouts. Gamma positioning supports bearish bias, but sharp moves can invalidate the analysis.
Disclaimer: This analysis is for educational purposes only and does not constitute financial advice. Always conduct your own research and risk management.
Declinazione di responsabilità
Le informazioni e le pubblicazioni non sono intese come, e non costituiscono, consulenza o raccomandazioni finanziarie, di investimento, di trading o di altro tipo fornite o approvate da TradingView. Per ulteriori informazioni, consultare i Termini di utilizzo.
Declinazione di responsabilità
Le informazioni e le pubblicazioni non sono intese come, e non costituiscono, consulenza o raccomandazioni finanziarie, di investimento, di trading o di altro tipo fornite o approvate da TradingView. Per ulteriori informazioni, consultare i Termini di utilizzo.