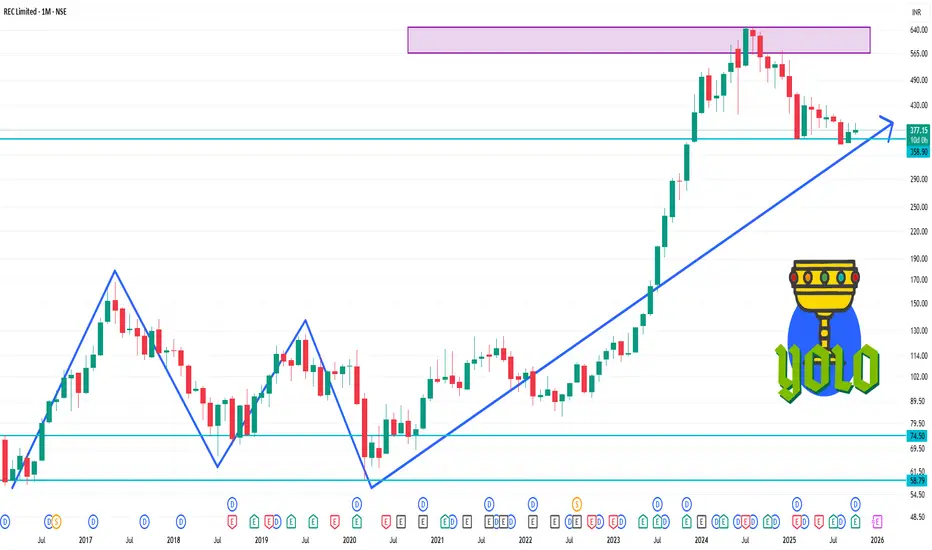
📉 Support & Resistance Levels
Support Levels:
S3: ₹369.23
S2: ₹374.15
S1: ₹376.45
Pivot: ₹378.85
R1: ₹383.00
R2: ₹385.40
R3: ₹389.90
Resistance Levels:
R1: ₹377.65
R2: ₹384.90
R3: ₹391.55
📈 Technical Indicators
Relative Strength Index (RSI): 48.79 – Indicates a neutral momentum.
MACD: -0.703 – Suggests mild bullish momentum.
Moving Averages:
5-day EMA: ₹374.76
15-day EMA: ₹374.89
50-day EMA: ₹378.40
100-day EMA: ₹388.38
200-day EMA: ₹406.67
The stock is trading below its short-term moving averages, indicating a bearish trend in the short term.
Pubblicazioni correlate
Declinazione di responsabilità
Le informazioni ed i contenuti pubblicati non costituiscono in alcun modo una sollecitazione ad investire o ad operare nei mercati finanziari. Non sono inoltre fornite o supportate da TradingView. Maggiori dettagli nelle Condizioni d'uso.
Pubblicazioni correlate
Declinazione di responsabilità
Le informazioni ed i contenuti pubblicati non costituiscono in alcun modo una sollecitazione ad investire o ad operare nei mercati finanziari. Non sono inoltre fornite o supportate da TradingView. Maggiori dettagli nelle Condizioni d'uso.
