🔍 Chart Analysis
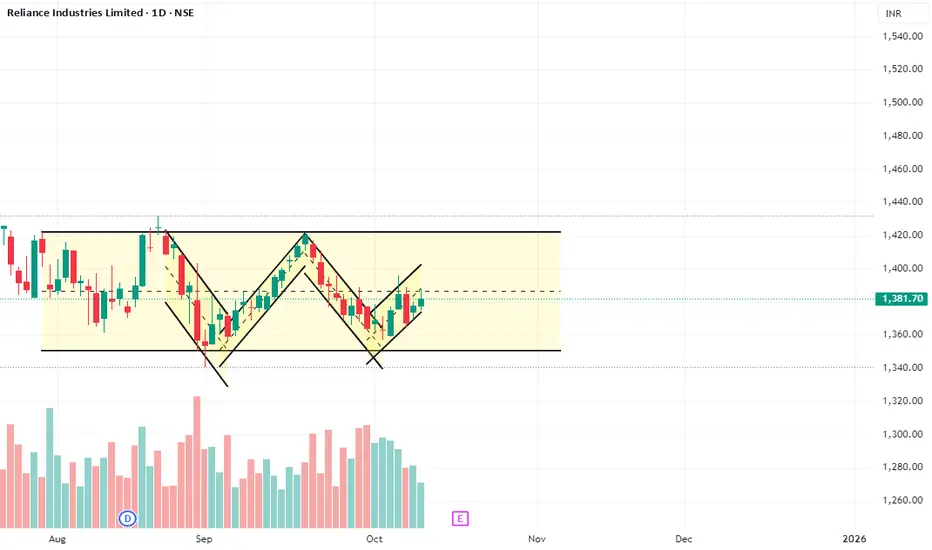
The chart for Reliance Industries Ltd. (RELIANCE) on the Daily timeframe shows the stock trading within a horizontal consolidation range since early August.
Pattern: The price is trapped in a Rectangle Pattern (consolidation range). Within this range, a visible 'W' pattern (Double Bottom) is forming between September and October.
Range Boundaries:
Resistance (Supply Zone): The upper boundary is around ₹1,420 - ₹1,430.
Support (Demand Zone): The lower boundary is around ₹1,345 - ₹1,355.
'W' Pattern Neckline: The neckline for the small 'W' pattern (the high between the two bottoms in September/October) is approximately at ₹1,400.
Current Position: The stock is currently trading just under the 'W' neckline at ₹1,381.70, near the midpoint of the larger consolidation range (indicated by the dashed line).
The Market Structure Shift (MSS) for the overall range would only be confirmed upon a decisive break of the main Resistance or Support. The small 'W' pattern suggests a potential short-term bullish move within the range, aiming for the upper boundary.
📈 Trade Plan (Range Trading & Short-Term Bullish Bias)
The plan has two components: a short-term move based on the 'W' pattern and a longer-term plan for the range breakout.
1. Short-Term Bullish Scenario (Within the Range)
This trade is based on the small 'W' (Double Bottom) pattern completing and pushing the price towards the main range resistance.
Entry Condition: A decisive close (Daily) ABOVE the 'W' Neckline of ₹1,400.
Stop Loss (SL): Place the stop loss below the recent swing low that forms the second bottom of the 'W', for example, around ₹1,365.
Target (T): Target the upper boundary of the main consolidation range at ₹1,420 - ₹1,430.
2. Breakout Plan (MSS Confirmation)
The most significant moves will occur when the stock breaks the main consolidation range.
Confirmed MSS to the Upside (Trend Continuation):
Entry Condition: A Daily close and sustained trade ABOVE ₹1,430 on strong volume. This would confirm the Market Structure Shift (MSS) to the upside.
Target: The minimum measured move would be the height of the range (₹1,430 - ₹1,350 = ₹80) projected upwards, yielding a Target ≈ ₹1,510.
Confirmed MSS to the Downside (Trend Reversal):
Entry Condition: A Daily close and sustained trade BELOW ₹1,350 on strong volume. This would confirm the Market Structure Shift (MSS) to the downside.
Target: The minimum measured move would be the height of the range (₹80) projected downwards, yielding a Target ≈ ₹1,270.
⚠️ Risk Management
Trading at the current price of ₹1,381.70 is risky as it is in the middle of the range.
Priority should be given to waiting for either the 'W' neckline (₹1,400) to break for the short-term target, or for the main range boundaries (₹1,430 or ₹1,350) to break for the larger trend trade. Wait for volume confirmation on all major breakouts.
Trade attivo
T1 is achieved. Book partially. SL to costDeclinazione di responsabilità
Le informazioni e le pubblicazioni non sono intese come, e non costituiscono, consulenza o raccomandazioni finanziarie, di investimento, di trading o di altro tipo fornite o approvate da TradingView. Per ulteriori informazioni, consultare i Termini di utilizzo.
Declinazione di responsabilità
Le informazioni e le pubblicazioni non sono intese come, e non costituiscono, consulenza o raccomandazioni finanziarie, di investimento, di trading o di altro tipo fornite o approvate da TradingView. Per ulteriori informazioni, consultare i Termini di utilizzo.