RGTI Weekly Outlook (Oct 28–31): “Quantum Pullback or Continuation? Watching $40 for the Next Big Move”
1. Weekly (1W) — Long-Term Structure
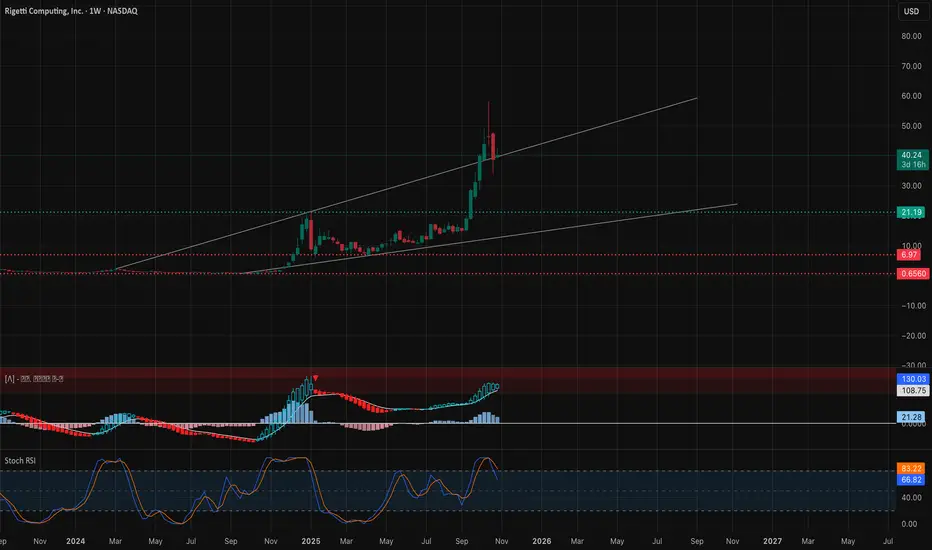
Rigetti Computing (RGTI) recently completed a massive breakout structure, with a BOS (Break of Structure) that sent price soaring from single digits into the $40 zone — a gain exceeding 500%. The stock is now undergoing its first healthy correction phase within a broad ascending channel.
* Trend Bias: Still bullish on higher timeframe.
* Support Levels: $22 → $18 → $10
* Resistance Levels: $40 → $55 → $75
* Momentum: Weekly MACD remains firmly bullish but histogram momentum is cooling — a normal retracement after parabolic expansion.
* Stoch RSI: Rotating down from overbought, showing consolidation rather than full reversal.
💡 Macro takeaway: The structure suggests continuation potential toward $55 once the pullback stabilizes. Maintaining above $18–$22 would confirm the higher low formation and keep long-term bulls in control.
2. Daily (1D) — Corrective Phase in Play

On the daily timeframe, RGTI is retracing after forming a high near $55. The latest daily candles show early stabilization as buyers defend near-term support at $38–$40, coinciding with the trendline and prior BOS zone.
* Market Structure: Still in a correction phase after a vertical breakout.
* Support Zones: $40 → $34 → $28
* Resistance Zones: $43 → $50 → $55
* Indicators:
* MACD remains bearish short-term, but histogram contraction suggests momentum loss on the downside.
* Stoch RSI showing a potential bullish cross from oversold territory.
📈 Daily insight: The base-building around $38–$40 is crucial. If bulls can reclaim $43–$45 with volume, the next leg toward $50–$55 could trigger, supported by short-covering momentum.
3. 1-Hour (1H) — Intraday Playbook

On the 1-hour chart, the price has reclaimed its short-term uptrend after a CHoCH → BOS sequence. The stock is attempting to hold above the local trendline and defend $40 as its key pivot level.
* Bias: Intraday bullish while holding above $38.
* Support: $38 → $36 → $34
* Resistance: $43 → $45 → $48
* Playbook Scenarios:
* Bullish scalp: Break above $43.50, target $45–$48 with stop under $40.
* Dip buy: Enter near $38–$39 if defended; risk below $36 for bounce back to $43.
* Bearish invalidation: Below $36 = structure break, opens $34 retest.
💬 Intraday read: Momentum on MACD is neutral but improving. A decisive push over $43 could trigger momentum ignition, aligning with the hourly ascending structure.
4. GEX & Options Sentiment
From the GEX (Gamma Exposure) data and volume structure:
* Highest Positive NETGEX / Gamma Wall: $45 → $50 zone.
* Call Walls: $43 → $50 → $55.
* Put Support: $38 → $34.
* IVR: Elevated at ~50+ (speculative sentiment strong).
* Call Sentiment: Heavily call-weighted, aligning with bullish bias post-consolidation.
🔍 Interpretation: As long as RGTI maintains above $38–$39, the gamma setup favors upside continuation. A break above $43 could ignite a push toward the $50 call wall region.
5. Suggested Option Setups
Bullish Play (Primary Bias):
* Play: 40C–45C (0–2DTE) breakout setup.
* Entry: Above $43 breakout confirmation.
* Targets: $45 → $48 → $50.
* Stop: Below $39.
Dip Buy Setup:
* Play: 40C (1DTE) near $38–$39 support bounce.
* Target: $43–$45.
* Stop: Below $36.
Bearish Hedge (only if breakdown):
* Play: 35P (1DTE) if price loses $36 structure.
* Target: $34 → $30.
* Stop: Above $39.
Directional Bias
RGTI remains a high-beta quantum computing momentum stock with strong institutional attention. While short-term cooling is evident, the structure still supports continuation once the $43–$45 zone breaks.
🎯 Primary Bias: Bullish continuation after correction. ⚠️ Invalidation: Breakdown below $36 → deeper retracement toward $30–$34 range.
This analysis is for educational purposes only and does not constitute financial advice. Always do your own research and manage risk before trading.
1. Weekly (1W) — Long-Term Structure
Rigetti Computing (RGTI) recently completed a massive breakout structure, with a BOS (Break of Structure) that sent price soaring from single digits into the $40 zone — a gain exceeding 500%. The stock is now undergoing its first healthy correction phase within a broad ascending channel.
* Trend Bias: Still bullish on higher timeframe.
* Support Levels: $22 → $18 → $10
* Resistance Levels: $40 → $55 → $75
* Momentum: Weekly MACD remains firmly bullish but histogram momentum is cooling — a normal retracement after parabolic expansion.
* Stoch RSI: Rotating down from overbought, showing consolidation rather than full reversal.
💡 Macro takeaway: The structure suggests continuation potential toward $55 once the pullback stabilizes. Maintaining above $18–$22 would confirm the higher low formation and keep long-term bulls in control.
2. Daily (1D) — Corrective Phase in Play
On the daily timeframe, RGTI is retracing after forming a high near $55. The latest daily candles show early stabilization as buyers defend near-term support at $38–$40, coinciding with the trendline and prior BOS zone.
* Market Structure: Still in a correction phase after a vertical breakout.
* Support Zones: $40 → $34 → $28
* Resistance Zones: $43 → $50 → $55
* Indicators:
* MACD remains bearish short-term, but histogram contraction suggests momentum loss on the downside.
* Stoch RSI showing a potential bullish cross from oversold territory.
📈 Daily insight: The base-building around $38–$40 is crucial. If bulls can reclaim $43–$45 with volume, the next leg toward $50–$55 could trigger, supported by short-covering momentum.
3. 1-Hour (1H) — Intraday Playbook
On the 1-hour chart, the price has reclaimed its short-term uptrend after a CHoCH → BOS sequence. The stock is attempting to hold above the local trendline and defend $40 as its key pivot level.
* Bias: Intraday bullish while holding above $38.
* Support: $38 → $36 → $34
* Resistance: $43 → $45 → $48
* Playbook Scenarios:
* Bullish scalp: Break above $43.50, target $45–$48 with stop under $40.
* Dip buy: Enter near $38–$39 if defended; risk below $36 for bounce back to $43.
* Bearish invalidation: Below $36 = structure break, opens $34 retest.
💬 Intraday read: Momentum on MACD is neutral but improving. A decisive push over $43 could trigger momentum ignition, aligning with the hourly ascending structure.
4. GEX & Options Sentiment
From the GEX (Gamma Exposure) data and volume structure:
* Highest Positive NETGEX / Gamma Wall: $45 → $50 zone.
* Call Walls: $43 → $50 → $55.
* Put Support: $38 → $34.
* IVR: Elevated at ~50+ (speculative sentiment strong).
* Call Sentiment: Heavily call-weighted, aligning with bullish bias post-consolidation.
🔍 Interpretation: As long as RGTI maintains above $38–$39, the gamma setup favors upside continuation. A break above $43 could ignite a push toward the $50 call wall region.
5. Suggested Option Setups
Bullish Play (Primary Bias):
* Play: 40C–45C (0–2DTE) breakout setup.
* Entry: Above $43 breakout confirmation.
* Targets: $45 → $48 → $50.
* Stop: Below $39.
Dip Buy Setup:
* Play: 40C (1DTE) near $38–$39 support bounce.
* Target: $43–$45.
* Stop: Below $36.
Bearish Hedge (only if breakdown):
* Play: 35P (1DTE) if price loses $36 structure.
* Target: $34 → $30.
* Stop: Above $39.
Directional Bias
RGTI remains a high-beta quantum computing momentum stock with strong institutional attention. While short-term cooling is evident, the structure still supports continuation once the $43–$45 zone breaks.
🎯 Primary Bias: Bullish continuation after correction. ⚠️ Invalidation: Breakdown below $36 → deeper retracement toward $30–$34 range.
This analysis is for educational purposes only and does not constitute financial advice. Always do your own research and manage risk before trading.
Declinazione di responsabilità
Le informazioni ed i contenuti pubblicati non costituiscono in alcun modo una sollecitazione ad investire o ad operare nei mercati finanziari. Non sono inoltre fornite o supportate da TradingView. Maggiori dettagli nelle Condizioni d'uso.
Declinazione di responsabilità
Le informazioni ed i contenuti pubblicati non costituiscono in alcun modo una sollecitazione ad investire o ad operare nei mercati finanziari. Non sono inoltre fornite o supportate da TradingView. Maggiori dettagli nelle Condizioni d'uso.