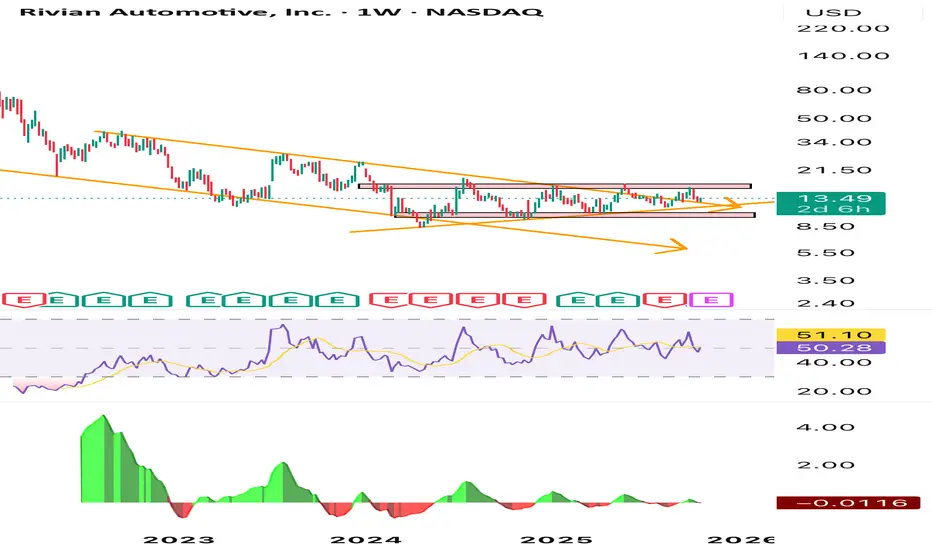
You’ve clearly identified a descending channel (orange lines) that has contained the stock’s downtrend since its IPO highs. Over time, Rivian’s price compressed into a symmetrical triangle or horizontal range between roughly $10–$16, signaling a classic “consolidation before decision” phase.
• Support: Around $10–11, repeatedly tested and held — forming a potential accumulation base.
• Resistance: Around $16, rejecting multiple breakout attempts.
• Trendlines: The upper descending trendline (orange) has been tested enough times to lose some strength — a breakout above $16–17 would likely trigger a technical rally.
If it breaks above $16 with volume, you might see a measured move target around $22–24, aligning with prior resistance levels.
If it breaks below $11.6, it could revisit $6–7, completing the larger descending channel pattern.
Institutional sentiment tends to cycle around major news catalysts (earnings, delivery updates, or cost-cutting milestones). The long sideways movement may suggest institutional accumulation, waiting for a macro tailwind (e.g., lower rates or positive EV policy incentives).
Declinazione di responsabilità
Le informazioni e le pubblicazioni non sono intese come, e non costituiscono, consulenza o raccomandazioni finanziarie, di investimento, di trading o di altro tipo fornite o approvate da TradingView. Per ulteriori informazioni, consultare i Termini di utilizzo.
Declinazione di responsabilità
Le informazioni e le pubblicazioni non sono intese come, e non costituiscono, consulenza o raccomandazioni finanziarie, di investimento, di trading o di altro tipo fornite o approvate da TradingView. Per ulteriori informazioni, consultare i Termini di utilizzo.