RUT has had multiple textbook crash patterns to date and if that continues we're going to soon see a capitulation period. Let's look at the markers of a break we have so far.
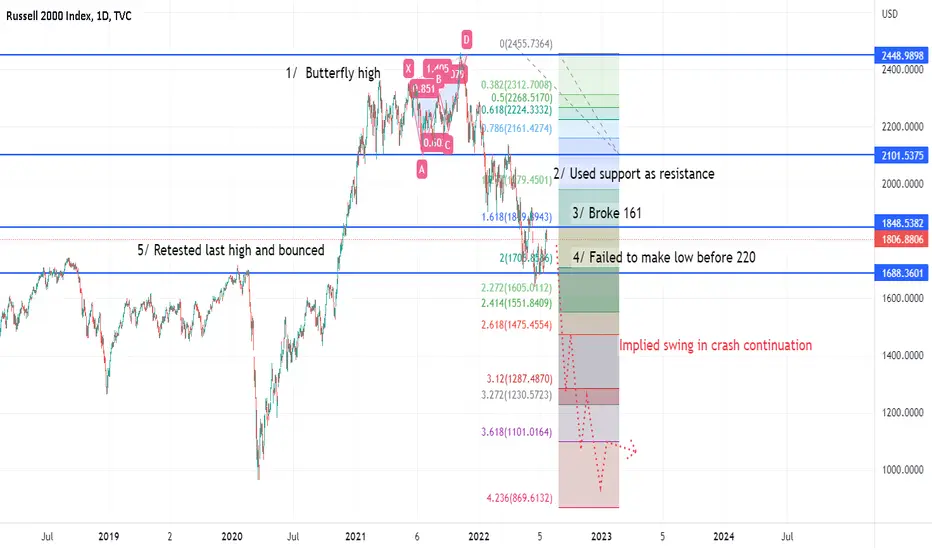
1/ The butterfly is a common topping pattern which usually forms when price rallies to ATH, has a sharp sell-off and then ranges for a long time. RUT formed this through 2021 and then the final spike of it came into the end of the year when the RUT started to reverse.
2/ After the initial drop we got under the support base that had held all of 2021. Which seems significant. A level holding price for a year is always liable to give us useful info later, and in this case the info we got was when it retested price was pushed away from it. What was once support is now resistance. To put this in an easier to understand why - what traders treated as cheap in 2021 they treated as expensive in 2022.
3/ The 161 break. After the rejection of the year range the 161 was always quite likely to hit but these do not break very often. The breaking of this level I think was significant. A breaking of a big 161 often signals the start of real market crashes.
4/ The market failed to hold before 220 fib. Which usually confirms a real breaking of the 161. Pullbacks are common but a reversal here is less likely. In downtrend continuation we just retest previous fib levels and then head lower to the next fib levels.
5/ A common marker I've noticed in a market break is we hit the obvious support level, have a bounce on that level and when you look at past crashes objectively it's easy to see this is an area where it'd look a lot like a low might be in. And many lows are actually made on supports like this, but in the times these dead-cat and break this is often a sign of complete bull trend failure. Capitulation comes next. Day after day, week after week the market is lower and lower.
A breaking of the last big lows would be the confirmation signal for the bearish breakout as per historic norms.
We may be inside of a crash event to 3000 in SPX.
Read the full case with backlog of historic analysis/forecasts here: holeyprofitnewsletter.substack.com/p/the-case-for-3000-in-spx
Read the full case with backlog of historic analysis/forecasts here: holeyprofitnewsletter.substack.com/p/the-case-for-3000-in-spx
Declinazione di responsabilità
Le informazioni ed i contenuti pubblicati non costituiscono in alcun modo una sollecitazione ad investire o ad operare nei mercati finanziari. Non sono inoltre fornite o supportate da TradingView. Maggiori dettagli nelle Condizioni d'uso.