📅 Sensex Daily Timeframe Analysis (1D) – As of 19 July 2025
📊 1. Market Summary
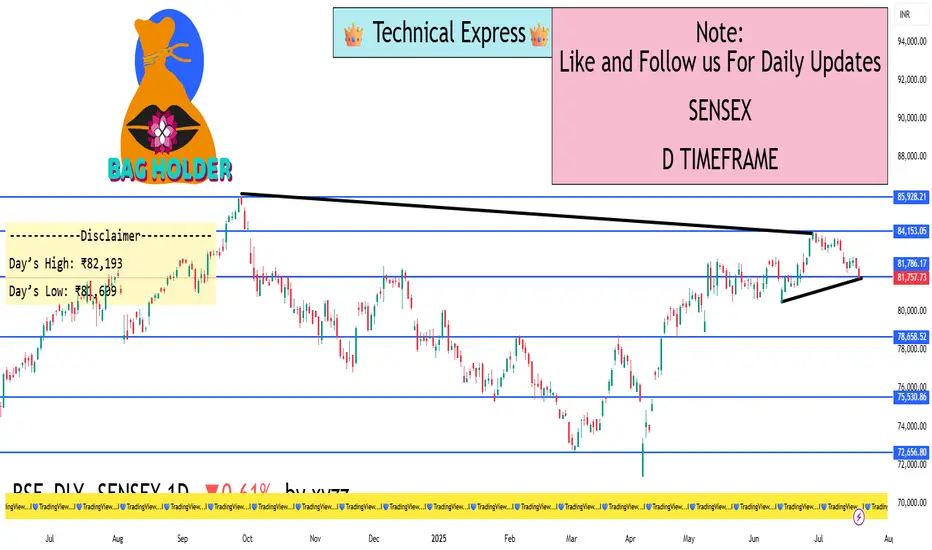
Closing Price: ₹81,758
Change from Previous Day: –502 points (–0.61%)
Day’s High: ₹82,193
Day’s Low: ₹81,609
52-Week High/Low: ₹85,978 / ₹71,425
➡️ Sensex dropped for the third day in a row and is showing signs of continued weakness.
🕯️ 2. Candlestick Behavior (1-Day Chart)
The candle formed is a bearish candle with a small body and an upper wick.
This means that the price went up intraday but couldn't hold and was sold off by the end of the day.
Sellers are actively pushing price down, especially near ₹82,000.
📉 3. Trend Direction
The market is in a clear downtrend.
This is seen by:
Lower highs (each peak is smaller than the last one)
Lower lows (each dip is deeper)
Sensex is unable to break back above key levels like ₹82,200 – showing strong selling pressure.
🧠 Trend Summary:
Price action is confirming bearish momentum. Buyers are weak, sellers are in control
📘 6. Volume & Market Strength
Volume is average to slightly rising on red (down) candles.
This shows active selling by institutions or large players.
No large green candle with volume = no strong buyer support yet.
💹 7. Simple Trading Strategy Based on 1D Timeframe
✅ If You’re a Swing Trader:
Bearish Bias: Sell on rise near ₹82,200 or ₹82,600
Target 1: ₹81,466
Target 2: ₹81,174
Stop Loss: Above ₹82,600 (or use trailing SL)
⚠️ If You’re Waiting for a Buy Opportunity:
Wait for price to touch ₹80,739 – ₹81,174 zone, then look for bullish reversal signals (big green candle, volume, RSI > 35)
🔚 Final Thoughts:
Sensex is under pressure.
No major recovery sign is seen yet.
A bounce is possible only near major support zones, but for now, bears are winning.
📊 1. Market Summary
Closing Price: ₹81,758
Change from Previous Day: –502 points (–0.61%)
Day’s High: ₹82,193
Day’s Low: ₹81,609
52-Week High/Low: ₹85,978 / ₹71,425
➡️ Sensex dropped for the third day in a row and is showing signs of continued weakness.
🕯️ 2. Candlestick Behavior (1-Day Chart)
The candle formed is a bearish candle with a small body and an upper wick.
This means that the price went up intraday but couldn't hold and was sold off by the end of the day.
Sellers are actively pushing price down, especially near ₹82,000.
📉 3. Trend Direction
The market is in a clear downtrend.
This is seen by:
Lower highs (each peak is smaller than the last one)
Lower lows (each dip is deeper)
Sensex is unable to break back above key levels like ₹82,200 – showing strong selling pressure.
🧠 Trend Summary:
Price action is confirming bearish momentum. Buyers are weak, sellers are in control
📘 6. Volume & Market Strength
Volume is average to slightly rising on red (down) candles.
This shows active selling by institutions or large players.
No large green candle with volume = no strong buyer support yet.
💹 7. Simple Trading Strategy Based on 1D Timeframe
✅ If You’re a Swing Trader:
Bearish Bias: Sell on rise near ₹82,200 or ₹82,600
Target 1: ₹81,466
Target 2: ₹81,174
Stop Loss: Above ₹82,600 (or use trailing SL)
⚠️ If You’re Waiting for a Buy Opportunity:
Wait for price to touch ₹80,739 – ₹81,174 zone, then look for bullish reversal signals (big green candle, volume, RSI > 35)
🔚 Final Thoughts:
Sensex is under pressure.
No major recovery sign is seen yet.
A bounce is possible only near major support zones, but for now, bears are winning.
I built a Buy & Sell Signal Indicator with 85% accuracy.
📈 Get access via DM or
WhatsApp: wa.link/d997q0
| Email: techncialexpress@gmail.com
| Script Coder | Trader | Investor | From India
📈 Get access via DM or
WhatsApp: wa.link/d997q0
| Email: techncialexpress@gmail.com
| Script Coder | Trader | Investor | From India
Pubblicazioni correlate
Declinazione di responsabilità
Le informazioni ed i contenuti pubblicati non costituiscono in alcun modo una sollecitazione ad investire o ad operare nei mercati finanziari. Non sono inoltre fornite o supportate da TradingView. Maggiori dettagli nelle Condizioni d'uso.