Silver looks like one of the clearest cases of mispricing in the current commodity supercycle. Fundamentally and from a demand-growth standpoint, silver is extremely strong, yet the market continues to price it as if the metal were abundant and optional, not structurally tight and increasingly indispensable.
The gold-to-silver ratio tells the story clearly: with gold around $4,065/oz and silver around $50/oz, the ratio sits near 81:1, far above the post-1970 historical mean of roughly 60:1. Historically, deviations above 75–80 have tended to be temporary dislocations that lasted 4–12 months before mean-reverting violently. In many such cases, the reversion came not from gold falling, but from silver accelerating upward at a much faster rate.
That setup is now repeating.
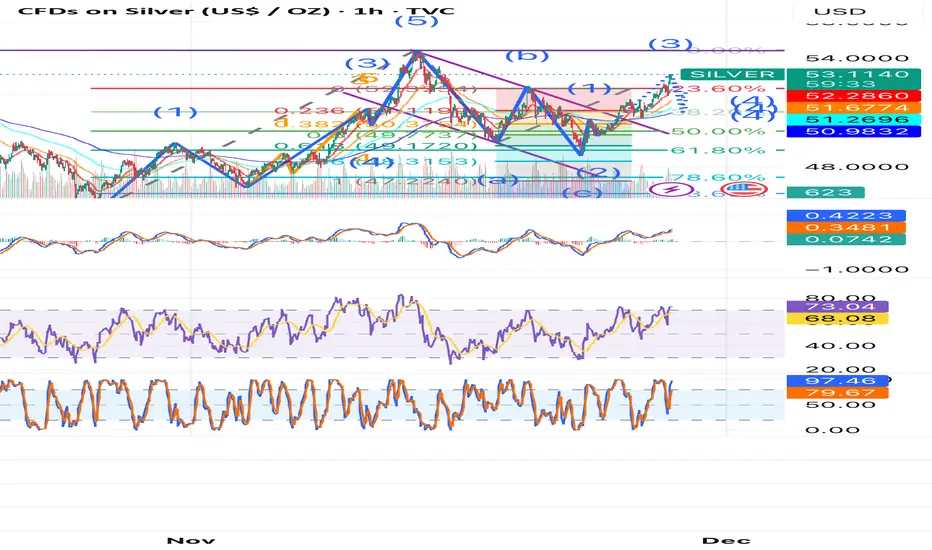
Technically, silver is sitting at a compelling entry zone. On the short-term structure, the metal has already broken above its downward corrective A-B-C channel, completing the C-wave at approximately 0.786 × Wave A rather than a full 1.0 extension, showing buyers stepped in early and with strength. This is often a hallmark of a developing impulse structure.
Price has also double-topped near the marked purple resistance around $54.50, which could be used as a short-term trade resistance or a long-term buying opportunity. A decisive breakout above this level with strong volume would confirm the beginning of a much larger impulse, which aligns cleanly with the broader Wave 5 interpretation on the 1-day chart. That gives the setup both:
- a macro-ratio tailwind, and
- a technical pattern showing the early phase of a bullish expansion leg.
Silver is acting like a coiled spring: ratio extreme, structural demand pressure, and impulsive wave dynamics all point toward a potential accelerated repricing phase.
The gold-to-silver ratio tells the story clearly: with gold around $4,065/oz and silver around $50/oz, the ratio sits near 81:1, far above the post-1970 historical mean of roughly 60:1. Historically, deviations above 75–80 have tended to be temporary dislocations that lasted 4–12 months before mean-reverting violently. In many such cases, the reversion came not from gold falling, but from silver accelerating upward at a much faster rate.
That setup is now repeating.
Technically, silver is sitting at a compelling entry zone. On the short-term structure, the metal has already broken above its downward corrective A-B-C channel, completing the C-wave at approximately 0.786 × Wave A rather than a full 1.0 extension, showing buyers stepped in early and with strength. This is often a hallmark of a developing impulse structure.
Price has also double-topped near the marked purple resistance around $54.50, which could be used as a short-term trade resistance or a long-term buying opportunity. A decisive breakout above this level with strong volume would confirm the beginning of a much larger impulse, which aligns cleanly with the broader Wave 5 interpretation on the 1-day chart. That gives the setup both:
- a macro-ratio tailwind, and
- a technical pattern showing the early phase of a bullish expansion leg.
Silver is acting like a coiled spring: ratio extreme, structural demand pressure, and impulsive wave dynamics all point toward a potential accelerated repricing phase.
Declinazione di responsabilità
Le informazioni e le pubblicazioni non sono intese come, e non costituiscono, consulenza o raccomandazioni finanziarie, di investimento, di trading o di altro tipo fornite o approvate da TradingView. Per ulteriori informazioni, consultare i Termini di utilizzo.
Declinazione di responsabilità
Le informazioni e le pubblicazioni non sono intese come, e non costituiscono, consulenza o raccomandazioni finanziarie, di investimento, di trading o di altro tipo fornite o approvate da TradingView. Per ulteriori informazioni, consultare i Termini di utilizzo.