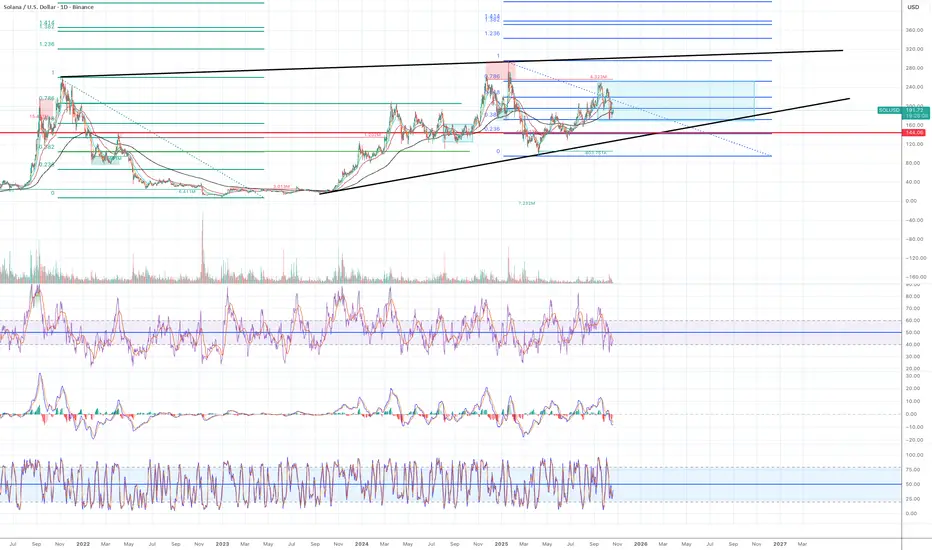
My macro bias for Solana is bullish. I invest in Solana and I mainly hodle the asset. The price action of Solana in the last 18 months has been very difficult, therefore, I have been avoiding to trade it. However, I am becoming cautiously optimistic as a Solana bull and I can see some clear signs of price recovery.
Look at a green major Fib retracement from the previous cycle ATH at $262 to the bear bottom at $8.25.
1) the price moved rapidly to $208 at Fib 0.786 in March 24. It spent about a month consolidating around that level but it eventually failed to break above and spent 8 months consolidating between Fib 0.382 and 0.786 range.
2) The price eventually broke above 0.786 and 0.1 and reached historical ATH at $293 in Jan 2025 and started a sharp decline to $95, which is roughly Fib 0.382 area.
Look at blue major Fib retracement from historical ATH to the recent bottom ($293 to $95).
1). The price moved to $250 at Fib 0.786 in mid Sept 2025. It spent several days consolidating around that level but it eventually failed to break to the Fib 0.382 zone at $172.
Based on the two major Fib retracements, I am watching to see if the price will hold above Fib 0.382 level. It is normal for the price to consolidate between Fib 0.618 and 0.382 but I often see Fib 0.786 and 0.236 to work as the last line of defense. Once the price goes above or below Fib 0786 and 0.236, the trend can start to break down. So as long as the price stays above Fib 0.236, but ideally above 0.382, my bias is bullish.
$144 (red horizontal line in the chart) is the level Solana had the last bull trap and started the macro bear cycle. This level should work as a strong support level.
I keep adding more to my position when the price dips to Fib 0.382 area at the moment but it is for investment.
For swing trading, I am waiting for the following conditions:
1) Daily candle closes above previous swing higher low at $191.80/
2) EMA 12 > EMA 21 > EMA 55
3) A daily candle is above EMA 200.
4) RSI lines cross to the upside and ideally enter the bull zone.
5) Stochastic are moving to the upside but not overbought.
6) MACD can stay in the bear zone but is starting to tilt to the upside.
Pubblicazioni correlate
Declinazione di responsabilità
Le informazioni ed i contenuti pubblicati non costituiscono in alcun modo una sollecitazione ad investire o ad operare nei mercati finanziari. Non sono inoltre fornite o supportate da TradingView. Maggiori dettagli nelle Condizioni d'uso.
Pubblicazioni correlate
Declinazione di responsabilità
Le informazioni ed i contenuti pubblicati non costituiscono in alcun modo una sollecitazione ad investire o ad operare nei mercati finanziari. Non sono inoltre fornite o supportate da TradingView. Maggiori dettagli nelle Condizioni d'uso.
