SOL/USDT – 4H Chart Summary
Market Structure:
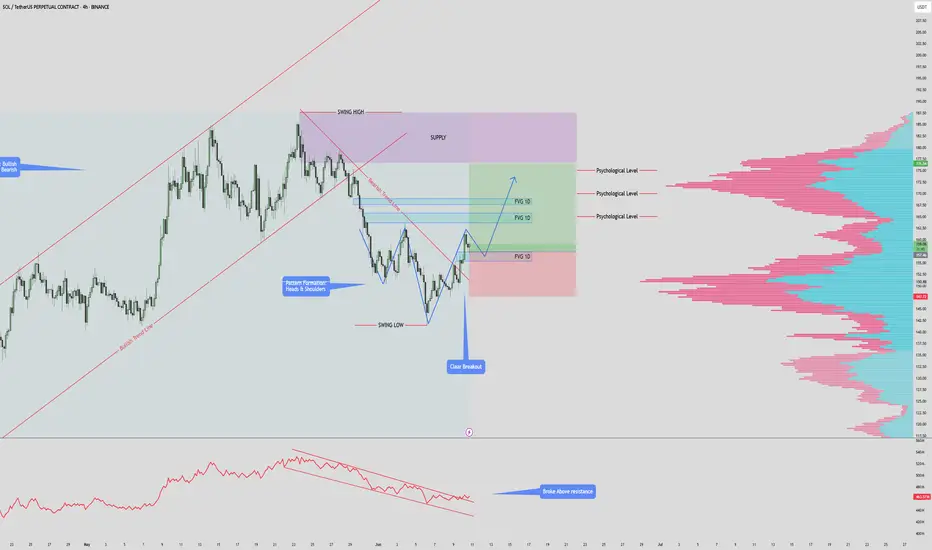
HTF: Bullish trend remains intact.
LTF: Previously bearish, now showing early signs of a bullish reversal.
Pattern Formation:
Potential Inverse Head & Shoulders forming.
Neckline at $157 — must hold for pattern to complete.
Break above previous high will invalidate Inverse Head & Shoulders.
Trendline & Breakout:
Price has broken above the descending bearish trendline.
Indicates a momentum shift from bearish to bullish.
Fair Value Gaps (FVG):
1D FVG below current price – potential retest & long entry zone.
2x 1D FVG above price – act as targets or supply areas.
Psychological Levels & Volume:
Key levels at $165, $170, $175.
Volume profile shows high liquidity at each of these levels – strong TP zones.
OBV Indicator:
OBV has broken above resistance – supports bullish continuation.
Trade Scenarios:
Bullish Setup:
Long on retest of lower FVG zone ($142–$145).
Target TPs: $165 → $170 → $175 (align with psychological & high-volume areas).
Invalidation:
Break below FVG support or failure to hold above $142.
Market Structure:
HTF: Bullish trend remains intact.
LTF: Previously bearish, now showing early signs of a bullish reversal.
Pattern Formation:
Potential Inverse Head & Shoulders forming.
Neckline at $157 — must hold for pattern to complete.
Break above previous high will invalidate Inverse Head & Shoulders.
Trendline & Breakout:
Price has broken above the descending bearish trendline.
Indicates a momentum shift from bearish to bullish.
Fair Value Gaps (FVG):
1D FVG below current price – potential retest & long entry zone.
2x 1D FVG above price – act as targets or supply areas.
Psychological Levels & Volume:
Key levels at $165, $170, $175.
Volume profile shows high liquidity at each of these levels – strong TP zones.
OBV Indicator:
OBV has broken above resistance – supports bullish continuation.
Trade Scenarios:
Bullish Setup:
Long on retest of lower FVG zone ($142–$145).
Target TPs: $165 → $170 → $175 (align with psychological & high-volume areas).
Invalidation:
Break below FVG support or failure to hold above $142.
Trade chiuso: obiettivo raggiunto
Unfortunately due to the war, Solana has hit how stop loss.
However it has also hit the second FVG zone leaving us just in profits of 7%
Well done to those who held the trade.
Declinazione di responsabilità
Le informazioni ed i contenuti pubblicati non costituiscono in alcun modo una sollecitazione ad investire o ad operare nei mercati finanziari. Non sono inoltre fornite o supportate da TradingView. Maggiori dettagli nelle Condizioni d'uso.
Declinazione di responsabilità
Le informazioni ed i contenuti pubblicati non costituiscono in alcun modo una sollecitazione ad investire o ad operare nei mercati finanziari. Non sono inoltre fornite o supportate da TradingView. Maggiori dettagli nelle Condizioni d'uso.