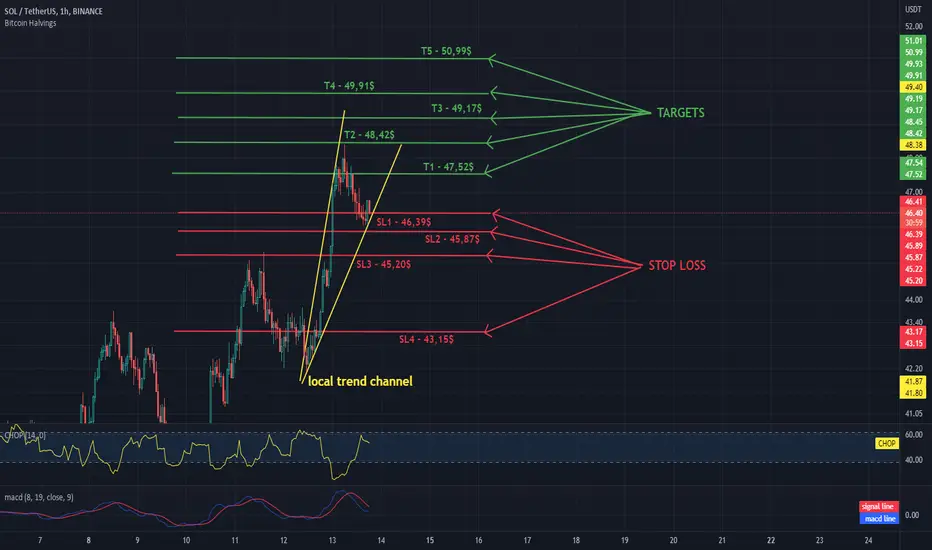
Hello everyone, let's take a look at the 1H SOL to USDT chart as you can see the price is moving in the channel denoted by the yellow lines.
Let's start by setting goals for the near future that we can consider:
T1 - $ 47.52
T2 - $ 48.42
T3 - $ 49.17
T4 - $ 49.91
and
T5 - $ 50.99
Now let's move on to the stop loss in case of further market declines:
SL1 - $ 46.39
SL2 - $ 45.87
SL3 - $ 45.20
and
SL4 - $ 43.15
Looking at the CHOP indicator, we can see that in the 1H range we still have a lot of energy for further moves, and the MACD indicator shows a local downward trend.
Declinazione di responsabilità
Le informazioni e le pubblicazioni non sono intese come, e non costituiscono, consulenza o raccomandazioni finanziarie, di investimento, di trading o di altro tipo fornite o approvate da TradingView. Per ulteriori informazioni, consultare i Termini di utilizzo.
Declinazione di responsabilità
Le informazioni e le pubblicazioni non sono intese come, e non costituiscono, consulenza o raccomandazioni finanziarie, di investimento, di trading o di altro tipo fornite o approvate da TradingView. Per ulteriori informazioni, consultare i Termini di utilizzo.