The S&P 500 has been climbing steadily, with the ascending trendline from April acting as a reliable backbone for the move. Despite short-term volatility, buyers continue to defend higher lows. Coupled with expectations of interest rate cuts, the trend structure remains intact unless key supports give way.
🔍 Technical Analysis
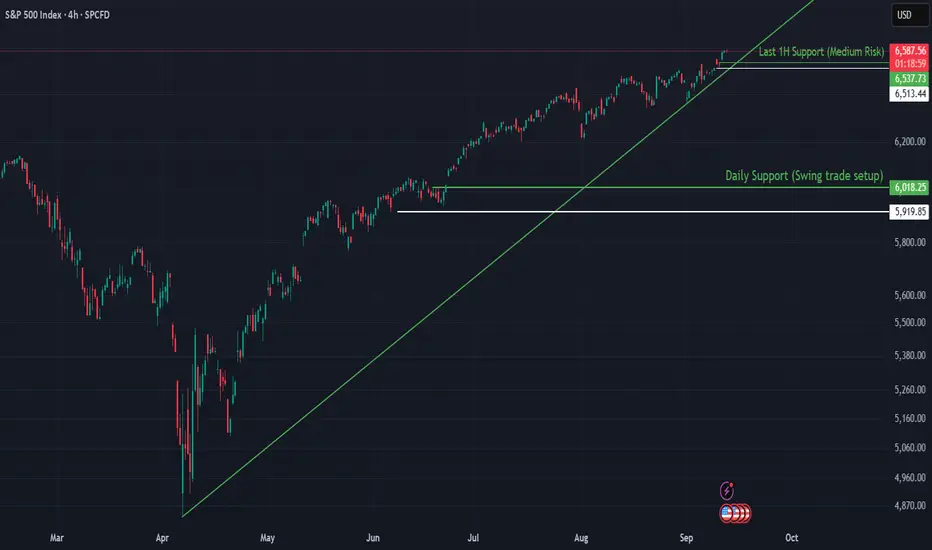
Current price: 6,584
The green trendline (since April) is guiding the advance.
Price is consolidating near highs, supported by demand zones underneath.
🛡️ Support Zones & Stop-Loss (White Lines):
🟢 6,537 – 1H Support (Medium Risk)
First line of defense for short-term traders.
Stop-loss: Below 6,513
🟡 6,018 – Daily Support (Swing Trade Setup)
Stronger base for medium-term positioning.
Stop-loss: Below 5,919
🧭 Outlook
Bullish Case: Hold above 6,537 + April trendline intact → continuation toward new highs above 6,600–6,700.
Bearish Case: Break below 6,537 could trigger a correction into 6,018. Losing that zone would weaken the April trendline structure.
Bias: Bullish while April trendline holds.
🌍 Fundamental Insight
Rate cut expectations continue to provide a macro tailwind for equities. With inflation moderating and yields easing, investors remain willing to support risk assets. A sudden shift in data or Fed tone, however, could test the resilience of the April trendline.
✅ Conclusion
The S&P 500 remains in a strong bullish structure, anchored by the April trendline. Unless supports at 6,537 or 6,018 are lost, the path of least resistance remains higher.
If you found this useful, please don’t forget to like and follow for more structure-based insights.
⚠️ Disclaimer
This analysis is for educational purposes only and does not constitute financial, investment, or trading advice.
🔍 Technical Analysis
Current price: 6,584
The green trendline (since April) is guiding the advance.
Price is consolidating near highs, supported by demand zones underneath.
🛡️ Support Zones & Stop-Loss (White Lines):
🟢 6,537 – 1H Support (Medium Risk)
First line of defense for short-term traders.
Stop-loss: Below 6,513
🟡 6,018 – Daily Support (Swing Trade Setup)
Stronger base for medium-term positioning.
Stop-loss: Below 5,919
🧭 Outlook
Bullish Case: Hold above 6,537 + April trendline intact → continuation toward new highs above 6,600–6,700.
Bearish Case: Break below 6,537 could trigger a correction into 6,018. Losing that zone would weaken the April trendline structure.
Bias: Bullish while April trendline holds.
🌍 Fundamental Insight
Rate cut expectations continue to provide a macro tailwind for equities. With inflation moderating and yields easing, investors remain willing to support risk assets. A sudden shift in data or Fed tone, however, could test the resilience of the April trendline.
✅ Conclusion
The S&P 500 remains in a strong bullish structure, anchored by the April trendline. Unless supports at 6,537 or 6,018 are lost, the path of least resistance remains higher.
If you found this useful, please don’t forget to like and follow for more structure-based insights.
⚠️ Disclaimer
This analysis is for educational purposes only and does not constitute financial, investment, or trading advice.
Trade attivo
Currently breaking the 170-day uptrend. Might see a big move downwardTrade chiuso: obiettivo raggiunto
Support Zone held the move upwardDeclinazione di responsabilità
Le informazioni e le pubblicazioni non sono intese come, e non costituiscono, consulenza o raccomandazioni finanziarie, di investimento, di trading o di altro tipo fornite o approvate da TradingView. Per ulteriori informazioni, consultare i Termini di utilizzo.
Declinazione di responsabilità
Le informazioni e le pubblicazioni non sono intese come, e non costituiscono, consulenza o raccomandazioni finanziarie, di investimento, di trading o di altro tipo fornite o approvate da TradingView. Per ulteriori informazioni, consultare i Termini di utilizzo.