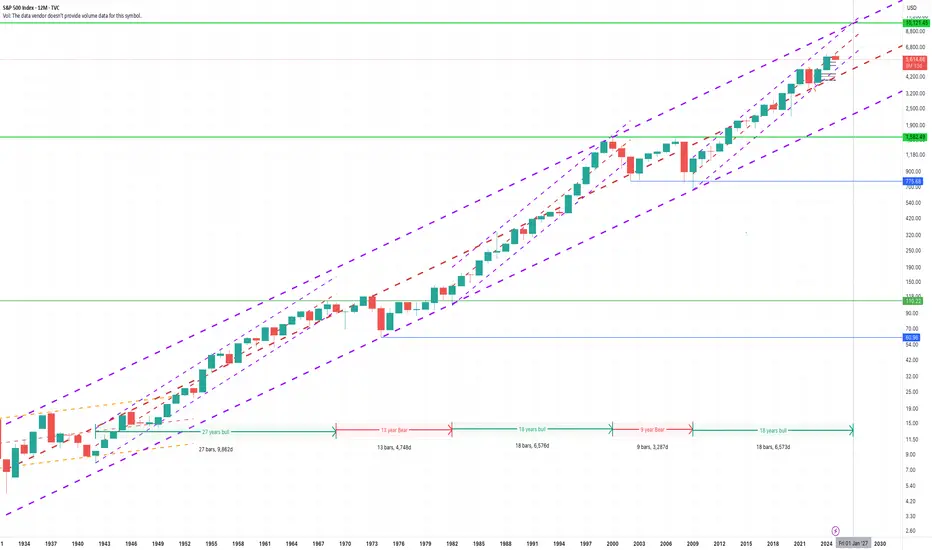
This chart shows the cyclical nature of the global economy, S&P500.
There is a clear correlation between a Bull supercycle and a 50% correction afterwards, which lasts for half the period of the supercycle.
First SuperCycle had a 27 years long growth, then 13.5 years correction.
Second SuperCycle had 18 years long growth and 9 years long correction.
Current SuperCycle ends in 2027 technically.
It is reasonable to sell your assets in 2026, at least 50% of all your portfolio.
Declinazione di responsabilità
Le informazioni ed i contenuti pubblicati non costituiscono in alcun modo una sollecitazione ad investire o ad operare nei mercati finanziari. Non sono inoltre fornite o supportate da TradingView. Maggiori dettagli nelle Condizioni d'uso.
Declinazione di responsabilità
Le informazioni ed i contenuti pubblicati non costituiscono in alcun modo una sollecitazione ad investire o ad operare nei mercati finanziari. Non sono inoltre fornite o supportate da TradingView. Maggiori dettagli nelle Condizioni d'uso.