SPX500 Weekly Trend Analysis
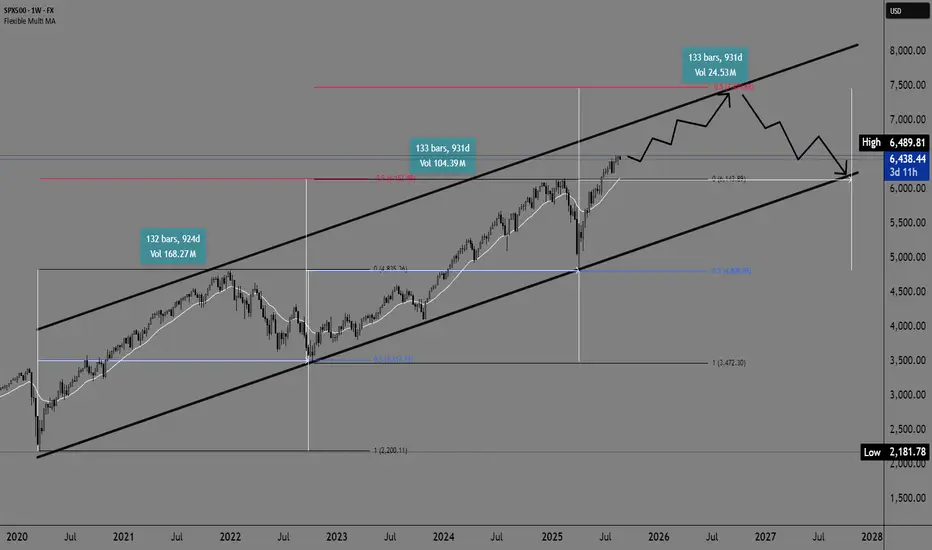
The SPX500 on a weekly timeframe continues to show an upward trend within a rising channel that has been in place since 2020. The price behavior in relation to the 50.0% Fibonacci retracement levels is particularly interesting—the previous two pullbacks both stopped at this key level, confirming its significant role as support.
As a reminder, after forming a low in 2020, the SPX500 entered a long bullish trend that lasted until December 2021, when it recorded its first high at 4500.00. After that, the index pulled back to the 50.0% Fibonacci level and then continued with a new bullish rally.
A new higher high was formed around 6000.00, which is again connected to the -50.0% Fibonacci level. The next pullback, similar to the previous one, found support at the 50.0% Fibonacci retracement, suggesting a continuation of the upward trend.
Based on this pattern, there is a realistic possibility of a new bullish rally with a potential target of 7500.00 (-50.0% Fibonacci level). Following the previous cycles from low to high and pullback, the average interval is approximately 920–930 days, which provides a rough time projection:
Next high: By the end of 2026
Next pullback: First part of 2027 or, at the latest, by October 2027
This pattern confirms the strong long-term growth structure and implies that the SPX500 will likely maintain its positive momentum for several more years, with periodic corrections that rely on key Fibonacci levels.
Free telegram channel t.me/alexmasterforex
Pubblicazioni correlate
Declinazione di responsabilità
Le informazioni e le pubblicazioni non sono intese come, e non costituiscono, consulenza o raccomandazioni finanziarie, di investimento, di trading o di altro tipo fornite o approvate da TradingView. Per ulteriori informazioni, consultare i Termini di utilizzo.