This week is one of those weeks where the entire market is revealing the real rotation under the surface. SPY broke its short-term channel, sectors are diverging, and GEX levels on SPY are loaded with heavy put support. When you zoom out, a clear message appears: the market isn’t collapsing — it’s rotating.
Here’s what SPY + sector map is telling us.
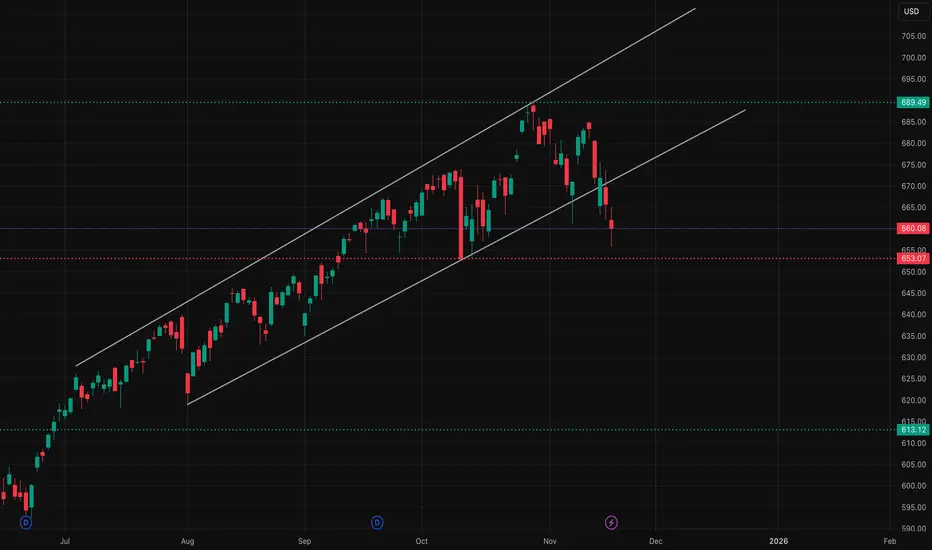
1. SPY — Daily Structure (1D)
The daily chart shows the clean channel that has guided SPY for months — and we finally broke below it. Price is sitting right on top of the demand area around 658–660, which has been tested multiple times since August.
Why this level matters:
* Hold above 658 → the structure is still intact
* Lose 658 → next macro liquidity lives down at 613
The market is essentially “resetting,” not crashing. This pullback aligns with sector rotation and GEX positioning, not panic selling.
2. SPY — 1H Trend (Short-Term)

The 1H chart is a clean downtrend: BOS after BOS, lower highs, and lower lows inside a descending channel.
Short-term key levels:
* 665–668 → rejection zone
* 675–680 → heavy resistance
* 655–658 → crucial support
You can see how price is reacting perfectly inside your channel draw — nothing random here, just structured selling.
3. SPY — 1H GEX (Options Sentiment)

This is where the story becomes very clear.
GEX Levels This Week:
* 675–680 → stacked CALL walls
* 660–663 → heaviest PUT support
* 652 → next negative GEX cluster
* Below 652 → volatility expands fast
Dealer flow is pinning SPY between 660–675, and until we break either side, expect choppy conditions.
GEX Bias:
* Neutral → Bearish under 668
* Bullish only if SPY breaks 675 with volume
This matches your 1H structure perfectly.
4. XLK (Tech) — The Sector Leading SPY Down

Tech makes up 30% of SPY, so whatever XLK does becomes SPY’s path.
XLK Daily: Breaking the rising channel and sitting right on support around 278–280. Lose this → 243 is next.
XLK 1H: Clean downtrend with repeated CHoCH/BOS structure. Upside needs a reclaim above 290–296, otherwise weakness continues.
This is the main reason SPY is heavy.
5. XLF (Financials) — The Quiet Weakness Nobody Talks About

XLF broke through its entire support range and is now testing 51.3–51.5.
Daily structure:
* Under all trendlines
* Losing momentum
* No strong buyers showing up
When both XLK + XLF are weak, SPY has no chance of recovering strongly.
6. XLE (Energy) — The Only Sector Showing Strength

This is your bullish rotation.
XLE daily chart is actually bullish right now:
* Holding above 91–93
* Stronger than every other major sector
* Money quietly rotating in while tech sells off
If SPY bounces later this week, XLE will be the one leading it.
7. XLY (Consumer Discretionary) — Another Drag on SPY

XLY broke its rising trendline and is now heading toward 224.5 support.
Tech + Consumer Discretionary = 42% of SPY → So both selling means SPY structurally must pull back.
Macro note: AMZN and TSLA weakness are driving this breakdown.
8. XLI (Industrials) — Sitting on Rising Support

XLI is hanging onto the rising trendline. This sector becomes important because:
* If Industrials break down → SPY sinks harder
* If Industrials bounce → market stabilizes
Key level: 149–150 Lose it → move to 142–145 begins.
⭐ Market Summary (Nov 18–21)
This is the cleanest way to summarize the entire map:
* SPY broke the channel but is sitting on demand
* Tech (XLK) and Discretionary (XLY) are the main weakness
* Financials (XLF) broke structure — adds pressure
* Energy (XLE) is the only major sector that’s bullish
* Industrials (XLI) are on a critical support
* GEX shows SPY pinned between 660–675 this week
* Volatility increases only if SPY breaks 658 or 652
This isn’t a collapse — it’s a rotation period where smart money repositions.
📝 Optional Trades & Bias
(Add if you want to include in your post)
* Bull case: SPY must reclaim 668 → 675
* Bear case: Under 658, downside accelerates
* Rotational long: XLE
* Risk-off: Avoid XLK until it reclaims 290+
📌 Disclaimer
This analysis is for educational purposes only. Not financial advice. Always manage your own risk.
Here’s what SPY + sector map is telling us.
1. SPY — Daily Structure (1D)
The daily chart shows the clean channel that has guided SPY for months — and we finally broke below it. Price is sitting right on top of the demand area around 658–660, which has been tested multiple times since August.
Why this level matters:
* Hold above 658 → the structure is still intact
* Lose 658 → next macro liquidity lives down at 613
The market is essentially “resetting,” not crashing. This pullback aligns with sector rotation and GEX positioning, not panic selling.
2. SPY — 1H Trend (Short-Term)
The 1H chart is a clean downtrend: BOS after BOS, lower highs, and lower lows inside a descending channel.
Short-term key levels:
* 665–668 → rejection zone
* 675–680 → heavy resistance
* 655–658 → crucial support
You can see how price is reacting perfectly inside your channel draw — nothing random here, just structured selling.
3. SPY — 1H GEX (Options Sentiment)
This is where the story becomes very clear.
GEX Levels This Week:
* 675–680 → stacked CALL walls
* 660–663 → heaviest PUT support
* 652 → next negative GEX cluster
* Below 652 → volatility expands fast
Dealer flow is pinning SPY between 660–675, and until we break either side, expect choppy conditions.
GEX Bias:
* Neutral → Bearish under 668
* Bullish only if SPY breaks 675 with volume
This matches your 1H structure perfectly.
4. XLK (Tech) — The Sector Leading SPY Down
Tech makes up 30% of SPY, so whatever XLK does becomes SPY’s path.
XLK Daily: Breaking the rising channel and sitting right on support around 278–280. Lose this → 243 is next.
XLK 1H: Clean downtrend with repeated CHoCH/BOS structure. Upside needs a reclaim above 290–296, otherwise weakness continues.
This is the main reason SPY is heavy.
5. XLF (Financials) — The Quiet Weakness Nobody Talks About
XLF broke through its entire support range and is now testing 51.3–51.5.
Daily structure:
* Under all trendlines
* Losing momentum
* No strong buyers showing up
When both XLK + XLF are weak, SPY has no chance of recovering strongly.
6. XLE (Energy) — The Only Sector Showing Strength
This is your bullish rotation.
XLE daily chart is actually bullish right now:
* Holding above 91–93
* Stronger than every other major sector
* Money quietly rotating in while tech sells off
If SPY bounces later this week, XLE will be the one leading it.
7. XLY (Consumer Discretionary) — Another Drag on SPY
XLY broke its rising trendline and is now heading toward 224.5 support.
Tech + Consumer Discretionary = 42% of SPY → So both selling means SPY structurally must pull back.
Macro note: AMZN and TSLA weakness are driving this breakdown.
8. XLI (Industrials) — Sitting on Rising Support
XLI is hanging onto the rising trendline. This sector becomes important because:
* If Industrials break down → SPY sinks harder
* If Industrials bounce → market stabilizes
Key level: 149–150 Lose it → move to 142–145 begins.
⭐ Market Summary (Nov 18–21)
This is the cleanest way to summarize the entire map:
* SPY broke the channel but is sitting on demand
* Tech (XLK) and Discretionary (XLY) are the main weakness
* Financials (XLF) broke structure — adds pressure
* Energy (XLE) is the only major sector that’s bullish
* Industrials (XLI) are on a critical support
* GEX shows SPY pinned between 660–675 this week
* Volatility increases only if SPY breaks 658 or 652
This isn’t a collapse — it’s a rotation period where smart money repositions.
📝 Optional Trades & Bias
(Add if you want to include in your post)
* Bull case: SPY must reclaim 668 → 675
* Bear case: Under 658, downside accelerates
* Rotational long: XLE
* Risk-off: Avoid XLK until it reclaims 290+
📌 Disclaimer
This analysis is for educational purposes only. Not financial advice. Always manage your own risk.
Declinazione di responsabilità
Le informazioni e le pubblicazioni non sono intese come, e non costituiscono, consulenza o raccomandazioni finanziarie, di investimento, di trading o di altro tipo fornite o approvate da TradingView. Per ulteriori informazioni, consultare i Termini di utilizzo.
Declinazione di responsabilità
Le informazioni e le pubblicazioni non sono intese come, e non costituiscono, consulenza o raccomandazioni finanziarie, di investimento, di trading o di altro tipo fornite o approvate da TradingView. Per ulteriori informazioni, consultare i Termini di utilizzo.