SPY – Key Reversal or Relief Bounce? GEX Shows Tight Battle Ahead ⚔️
📆 Daily Timeframe – Macro Trend Holding by a Thread
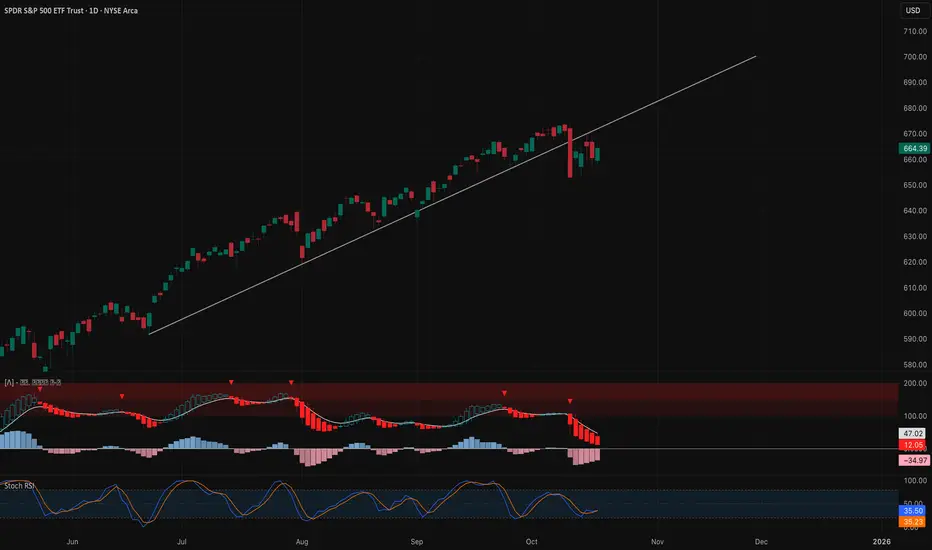
SPY remains in a broad uptrend channel but is now testing the rising trendline from June’s base. The recent pullback from the all-time high at $688 → $660 was sharp but controlled — a healthy correction unless we break decisively below $653–$650.
* MACD continues to bleed lower with bearish momentum but histogram bars are flattening — early signs of loss in selling strength.
* Stoch RSI sits mid-zone near 35–55, suggesting a possible reset before next leg.
* As long as SPY holds above $653, the macro trend remains bullish, but a daily close under that opens room toward $632 (channel base).
Upside: reclaiming $671–$675 would re-ignite momentum toward $690–$700. Downside: losing $653 confirms deeper correction phase.
⏱ 1-Hour Timeframe – Structure Reversal in Progress

SPY has printed a clear Change of Character (CHoCH) off the $652 demand zone, bouncing to retest its descending channel. Price is currently pressing into the $665–$670 supply band.
* MACD flipped bullish and shows expanding positive histogram bars.
* Stoch RSI in overbought zone, signaling short-term exhaustion.
* Key levels:
* Support: $657 / $653
* Resistance: $670.2 / $672
A clean hourly close above $670.2 opens a potential breakout run toward $675–$678, but failure could trigger another pullback to $657–$660.
⚡️ 15-Minute Timeframe – Intraday Battle Between Bulls and Bears

The 15-minute chart shows a rising wedge inside a corrective phase. Multiple BOS and CHoCH prints confirm a tug-of-war around the intraday midline ($665).
* MACD is curling down from high zone, suggesting short-term consolidation or a micro-pullback before the next leg.
* Stoch RSI crossing below 50 — intraday momentum fading.
Scalp Scenarios:
* Bullish: reclaim above $668.7 → target $671–$673, stop below $662.
* Bearish: break below $661 → target $656–$653, stop above $665.5.
Expect choppy reactions around $665 due to overlapping liquidity clusters.
📊 Options & GEX Sentiment View – Institutional Positioning Insight

Gamma Exposure (GEX) data shows a balanced battlefield with slightly bullish bias.
* Highest Call Wall / Gamma Resistance: $675
* Major Call Walls: $670 / $672.5
* Heavy Put Support: $658 / $653 / $647
* HVL (High Volatility Line): $660 for 10/20 expiry
Net Positioning:
* Call dominance near $665–$672, suggesting dealers will hedge upward if SPY continues climbing.
* Puts remain concentrated below $653, acting as magnetic support should volatility spike.
* IVR 28.1, IVx Avg 19.6, and Put$ 100.6% dominance reflect a hedged but not panic-driven market.
If SPY sustains above $665, gamma flips positive — encouraging smoother upward grind into $670–$675. Below $660, delta hedging may amplify drops into $653–$647.
🎯 Outlook for Monday–Tuesday
Expect SPY to oscillate between $660–$672 early week. Macro uptrend remains intact but fragile — a decisive break above $675 could invite strong momentum buying, while a close under $653 may confirm deeper correction.
Traders should stay patient and fade extremes within that range until gamma or volume breakout confirms direction.
Disclaimer: This analysis is for educational purposes only and does not constitute financial advice. Always do your own research and trade responsibly.
📆 Daily Timeframe – Macro Trend Holding by a Thread
SPY remains in a broad uptrend channel but is now testing the rising trendline from June’s base. The recent pullback from the all-time high at $688 → $660 was sharp but controlled — a healthy correction unless we break decisively below $653–$650.
* MACD continues to bleed lower with bearish momentum but histogram bars are flattening — early signs of loss in selling strength.
* Stoch RSI sits mid-zone near 35–55, suggesting a possible reset before next leg.
* As long as SPY holds above $653, the macro trend remains bullish, but a daily close under that opens room toward $632 (channel base).
Upside: reclaiming $671–$675 would re-ignite momentum toward $690–$700. Downside: losing $653 confirms deeper correction phase.
⏱ 1-Hour Timeframe – Structure Reversal in Progress
SPY has printed a clear Change of Character (CHoCH) off the $652 demand zone, bouncing to retest its descending channel. Price is currently pressing into the $665–$670 supply band.
* MACD flipped bullish and shows expanding positive histogram bars.
* Stoch RSI in overbought zone, signaling short-term exhaustion.
* Key levels:
* Support: $657 / $653
* Resistance: $670.2 / $672
A clean hourly close above $670.2 opens a potential breakout run toward $675–$678, but failure could trigger another pullback to $657–$660.
⚡️ 15-Minute Timeframe – Intraday Battle Between Bulls and Bears
The 15-minute chart shows a rising wedge inside a corrective phase. Multiple BOS and CHoCH prints confirm a tug-of-war around the intraday midline ($665).
* MACD is curling down from high zone, suggesting short-term consolidation or a micro-pullback before the next leg.
* Stoch RSI crossing below 50 — intraday momentum fading.
Scalp Scenarios:
* Bullish: reclaim above $668.7 → target $671–$673, stop below $662.
* Bearish: break below $661 → target $656–$653, stop above $665.5.
Expect choppy reactions around $665 due to overlapping liquidity clusters.
📊 Options & GEX Sentiment View – Institutional Positioning Insight
Gamma Exposure (GEX) data shows a balanced battlefield with slightly bullish bias.
* Highest Call Wall / Gamma Resistance: $675
* Major Call Walls: $670 / $672.5
* Heavy Put Support: $658 / $653 / $647
* HVL (High Volatility Line): $660 for 10/20 expiry
Net Positioning:
* Call dominance near $665–$672, suggesting dealers will hedge upward if SPY continues climbing.
* Puts remain concentrated below $653, acting as magnetic support should volatility spike.
* IVR 28.1, IVx Avg 19.6, and Put$ 100.6% dominance reflect a hedged but not panic-driven market.
If SPY sustains above $665, gamma flips positive — encouraging smoother upward grind into $670–$675. Below $660, delta hedging may amplify drops into $653–$647.
🎯 Outlook for Monday–Tuesday
Expect SPY to oscillate between $660–$672 early week. Macro uptrend remains intact but fragile — a decisive break above $675 could invite strong momentum buying, while a close under $653 may confirm deeper correction.
Traders should stay patient and fade extremes within that range until gamma or volume breakout confirms direction.
Disclaimer: This analysis is for educational purposes only and does not constitute financial advice. Always do your own research and trade responsibly.
Trade attivo
Midday Update — Cooling Off After Morning Rally SPY pulled back slightly from the $672 zone after a strong morning breakout fueled by multiple BOS (Break of Structure) confirmations. Price is now consolidating near $670.5, sitting above short-term demand.
Support: $669 → $666.7
Resistance: $671.4 → $672
MACD: Bearish crossover forming — showing momentum cooling
Stoch RSI: Rolling down from overbought, confirming short-term exhaustion
So far, this looks like a healthy intraday pullback. As long as $669 holds, bulls remain in control for another push toward $672–$674. A drop under $666.7 could signal deeper retrace toward $664–$663.
----
Trade chiuso: obiettivo raggiunto
update for scalping this morning Oct 21SPY is ranging between 670–672.5, showing indecision after yesterday’s CHoCH and BOS pattern. Structure is neutral with a slight bearish bias unless 672.5 breaks cleanly.
Resistance: 672.4 → 673.5
Support: 670.4 → 669.8
Bullish case: Reclaim 672+ for move toward 674.
Bearish case: Lose 670 → drop toward 669–668.8.
MACD flattening, Stoch RSI oversold — expecting early bounce attempts, but momentum still weak.
👉 Watch for breakout confirmation above 672.5 or breakdown below 670 to set direction.
Declinazione di responsabilità
Le informazioni e le pubblicazioni non sono intese come, e non costituiscono, consulenza o raccomandazioni finanziarie, di investimento, di trading o di altro tipo fornite o approvate da TradingView. Per ulteriori informazioni, consultare i Termini di utilizzo.
Declinazione di responsabilità
Le informazioni e le pubblicazioni non sono intese come, e non costituiscono, consulenza o raccomandazioni finanziarie, di investimento, di trading o di altro tipo fornite o approvate da TradingView. Per ulteriori informazioni, consultare i Termini di utilizzo.