Hello traders!
If you "Follow" us, you can always get new information quickly.
Please also click “Boost”.
Have a good day.
-------------------------------------
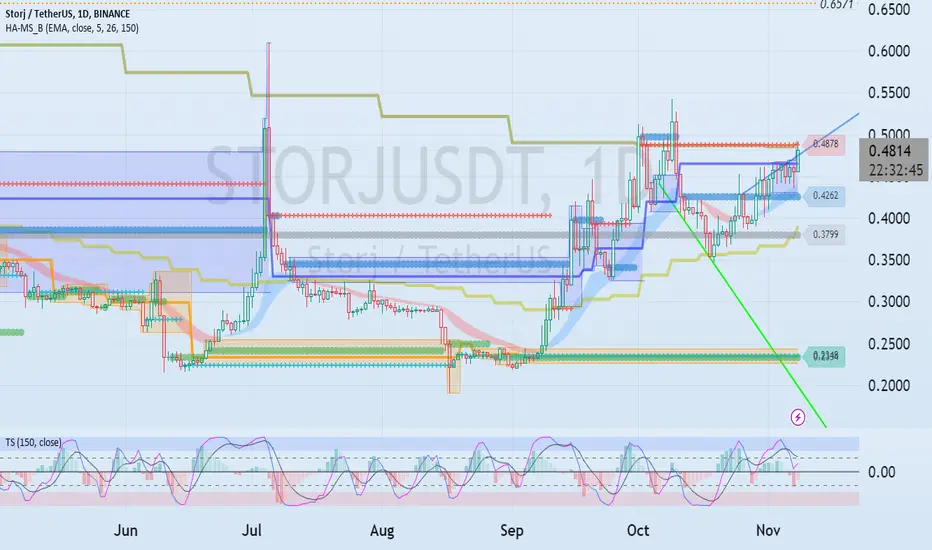
(STRJUSDT chart)

If it receives support in the 0.4292-0.4878 range and rises, it is expected that a full-fledged upward trend will begin.
(1W chart)

However, a rapid upward trend is expected to begin when the box range of 0.6939-3.1133 is shortened and a new box range is formed.
Therefore, it is expected that the price will rise above 0.4878 and shake up and down, creating a new HA-High indicator.
(1D chart)

If it rises above 0.4878 and becomes supported, the first support and resistance area is expected to be around 0.6571-0.7225.
--------------------------------------------------
- The big picture

The full-fledged upward trend is expected to begin when the price rises above 29K.
This is the section expected to be touched in the next bull market, 81K-95K.
-------------------------------------------------- -------------------------------------------
** All explanations are for reference only and do not guarantee profit or loss in investment.
** Trading volume is displayed as a candle body based on 10EMA.
How to display (in order from darkest to darkest)
More than 3 times the trading volume of 10EMA > 2.5 times > 2.0 times > 1.25 times > Trading volume below 10EMA
** Even if you know other people’s know-how, it takes a considerable amount of time to make it your own.
** This chart was created using my know-how.
---------------------------------
If you "Follow" us, you can always get new information quickly.
Please also click “Boost”.
Have a good day.
-------------------------------------
(STRJUSDT chart)
If it receives support in the 0.4292-0.4878 range and rises, it is expected that a full-fledged upward trend will begin.
(1W chart)
However, a rapid upward trend is expected to begin when the box range of 0.6939-3.1133 is shortened and a new box range is formed.
Therefore, it is expected that the price will rise above 0.4878 and shake up and down, creating a new HA-High indicator.
(1D chart)
If it rises above 0.4878 and becomes supported, the first support and resistance area is expected to be around 0.6571-0.7225.
--------------------------------------------------
- The big picture
The full-fledged upward trend is expected to begin when the price rises above 29K.
This is the section expected to be touched in the next bull market, 81K-95K.
-------------------------------------------------- -------------------------------------------
** All explanations are for reference only and do not guarantee profit or loss in investment.
** Trading volume is displayed as a candle body based on 10EMA.
How to display (in order from darkest to darkest)
More than 3 times the trading volume of 10EMA > 2.5 times > 2.0 times > 1.25 times > Trading volume below 10EMA
** Even if you know other people’s know-how, it takes a considerable amount of time to make it your own.
** This chart was created using my know-how.
---------------------------------
※ Follow X to check out the posts.
※ X를 팔로우하고 게시물을 확인하세요.
◆ t.me/readCryptoChannel
[HA-MS Indicator]
bit.ly/3YxHgvN
[OBV Indicator]
bit.ly/4dcyny3
※ X를 팔로우하고 게시물을 확인하세요.
◆ t.me/readCryptoChannel
[HA-MS Indicator]
bit.ly/3YxHgvN
[OBV Indicator]
bit.ly/4dcyny3
Pubblicazioni correlate
Declinazione di responsabilità
Le informazioni e le pubblicazioni non sono intese come, e non costituiscono, consulenza o raccomandazioni finanziarie, di investimento, di trading o di altro tipo fornite o approvate da TradingView. Per ulteriori informazioni, consultare i Termini di utilizzo.